

Question: You randomly select 100 drivers ages 15 to 19 from Example 4. What is the probability that the mean time they spend driving each day
You randomly select 100 drivers ages 15 to 19 from Example 4. What is the probability that the mean time they spend driving each day is between 24.7 and 25.5 minutes? Use μ = 25 minutes and σ = 1.5 minutes.
a. Use the Central Limit Theorem to find μx̅ and σx̅ and sketch the sampling distribution of the sample means.
b. Find the z-scores that correspond to x̅ = 24.7 minutes and x̅ = 25.5 minutes.
c. Find the cumulative area that corresponds to each z-score and calculate the probability that the mean time spent driving is between 24.7 and 25.5 minutes.
d. Interpret the results.
Example 4
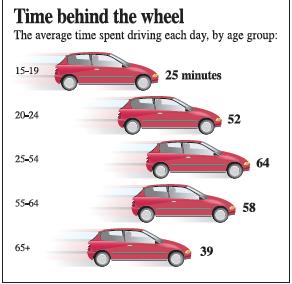
Time behind the wheel The average time spent driving each day, by age group: 15-19 25 minutes 20-24 52 25-54 64 55-64 58 65+ 39
Step by Step Solution
3.44 Rating (173 Votes )
There are 3 Steps involved in it
a b c P z 2 00228 Pz 333 09996 P 247 x 255 P 2 z 333 ... View full answer

Get step-by-step solutions from verified subject matter experts
Document Format (1 attachment)
598-M-S-P (4891).docx
120 KBs Word File