

Question: (a) Plot U.S. petroleum imports on a graph. (b) Describe the trend (if any) and discuss possible causes. (c) Fit both a linear and an
(a) Plot U.S. petroleum imports on a graph.
(b) Describe the trend (if any) and discuss possible causes.
(c) Fit both a linear and an exponential trend.
(c) Interpret each fitted trend equation, explaining the implications.
(d) Make a projection for 2010. Do you believe it?
(e) To whom is this issue relevant? Note: Time increments are 5 years, so use t = 11 for the 2010 forecast.
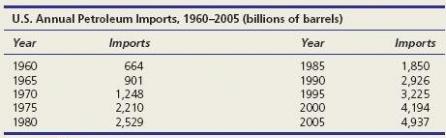
U.S. Annual Petroleum Imports, 1960-2005 (billions of barrels) Imports Imports ear ear 1960 1965 1970 1975 1980 664 901 1,248 2,210 2,529 1985 1990 1995 2000 2005 1,850 2,926 3,225 4,194 4,937
Step by Step Solution
3.33 Rating (162 Votes )
There are 3 Steps involved in it
a b We see an overall increasing trend in imports Fuel consumption ... View full answer

Get step-by-step solutions from verified subject matter experts
Document Format (1 attachment)
485-M-S-S-I (1817).docx
120 KBs Word File