

Question: A sociologist is interested in the relation between x = number of job changes and y = annual salary (in thousands of dollars) for people
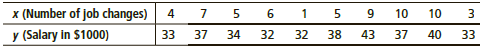
A sociologist is interested in the relation between x = number of job changes and y = annual salary (in thousands of dollars) for people living in the Nashville area. A random sample of 10 people employed in Nashville provided the following information:
Σx = 60; Σy = 359; Σx2 = 442; Σy2 = 13,013; Σxy = 2231
(a) Draw a scatter diagram for the data.
(b) Find x, y, b, and the equation of the least-squares line. Plot the line on the scatter diagram of part (a).
(c) Find the sample correlation coefficient r and the coefficient of determination. What percentage of variation in y is explained by the least-squares model?
(d) Test the claim that the population correlation coefficient r is positive at the 5% level of significance.
(e) If someone had x = 2 job changes, what does the least-squares line predict for y, the annual salary?
(f) Verify that Se ≈ 2.56.
(g) Find a 90% confidence interval for the annual salary of an individual with x = 2 job changes.
(h) Test the claim that the slope b of the population least-squares line is positive at the 5% level of significance.
(i) Find a 90% confidence interval for β and interpret its meaning.
x (Number of job changes) 4 75615 9 0 0 3 y (Salary in S1000) 33 37 34 32 32 38 43 37 40 33
Step by Step Solution
3.39 Rating (174 Votes )
There are 3 Steps involved in it
a b c This means that 579 of the variation in salary can be explained by the corres... View full answer

Get step-by-step solutions from verified subject matter experts
Document Format (1 attachment)
1275-M-S-P-E(1419).docx
120 KBs Word File