

Question: C) find the sample correlation coefficient r and the coefficient of determination. round your answer to three decimal places. r= and r^2. D) what is
C) find the sample correlation coefficient r and the coefficient of determination. round your answer to three decimal places. r= and r^2. D) what is the percentage of variation in y is explained by the least-square model. round your answer to one decimal places. E) test the claim that the population correlation coefficient p is positive at the 5% level of significance. round your test statistics to three decimal places. F) if someone had =3 job change, what does the least-square line predict for y, the annual salary? round your answer to two decimal places. G) find se. round your answer to two decimal places. H) find a 90% confidence interval for the annual salary of an individual with x=3 job change. round your answer to two decimal places. lower limits and upper limits. I) test the claim that the slope b of the population least-square line is positive at the 5% level of significance. round your test statistics to three decimal places. J) find a 90% confidence interval for b and interpret its meaning. round your answer to three decimal places. upper limits and lower limits.
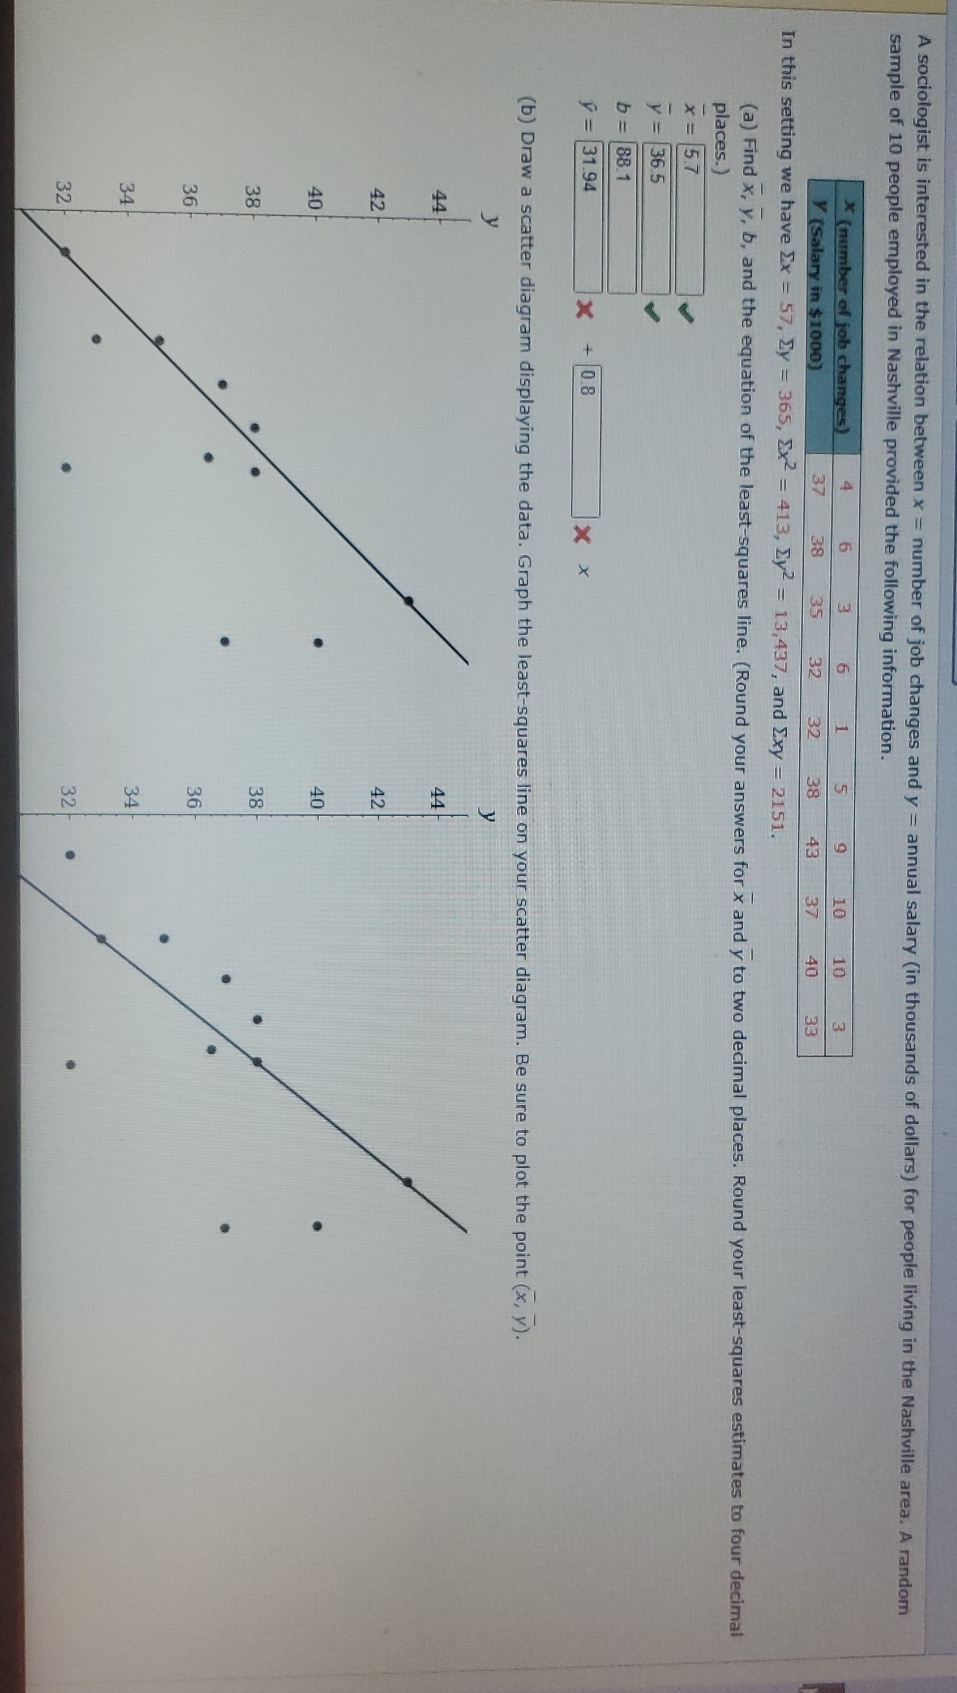
A sociologist is interested in the relation between x = number of job changes and y = annual salary (in thousands of dollars) for people living in the Nashville area. A random sample of 10 people employed in Nashville provided the following information. X ( number of job changes) LO m LO V (Salary in $1000) 37 38 m In this setting we have Ex = 57, Ey = 365, Ex2 = 413, Ey? = 13,437, and Exy = 2151. (a) Find x, y, b, and the equation of the least-squares line. (Round your answers for x and y to two decimal places. Round your least-squares estimates to four decimal places.) x = 5 V = 365 = 188.1 = 31.94 X + X x (b) Draw a scatter diagram displaying the data. Graph the least-squares line on your scatter diagram. Be sure to plot the point (x, y). 9 co 36 34
Step by Step Solution
There are 3 Steps involved in it

Get step-by-step solutions from verified subject matter experts