

Question: A study was done to determine the impact of two factors, method of analysis and the laboratory doing the analysis, on the level of sulfur
A study was done to determine the impact of two factors, method of analysis and the laboratory doing the analysis, on the level of sulfur content in coal. Twenty-eight coal specimens were randomly assigned to 28 factor combinations, the structure of the experimental units represented by combinations of seven laboratories and two methods of analysis with two specimens per factor combination. The data are as follows: The response is percent of sulfur. The data are taken from Taguchi, G. "Signal to Noise Ratio and Its Applications to Testing Material," Reports of Statistical Application Research, Union of Japanese Scientists and Engineers, Vol. 18, No. 4, 1971.(a) Do an analysis of variance and show results in an analysis-of-variance table.(b) Is interaction significant? If so, discuss what it means to the scientist. Use a P-value in your conclusion.(c) Are the individual main effects, laboratory, and method of analysis statistically significant? Discuss what is learned and let your answer be couched in the context of any significant interaction.(d) Do an interaction plot that illustrates the effect of interaction.(e) Do a test comparing methods 1 and 2 at laboratory 1 and do the same test at laboratory 7. Comment on what these resultsillustrate.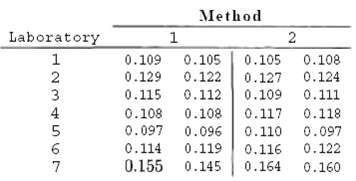
Method Laboratory 2 0.109 0.129 0.105 0.122 0.105 0.108 0.124 0.127 0.115 0.112 0.109 0.111 0.108 0.108 0.117 0.118 0.097 0.096 0.110 0.097 0.114 0.119 0.116 0.122 0.155 0.145 0.164 0.160 1234567
Step by Step Solution
3.35 Rating (179 Votes )
There are 3 Steps involved in it
a The ANOVA table is Source of Variation Method Lab MethodLab Error Total Sum of Squares 0000104 000... View full answer

Get step-by-step solutions from verified subject matter experts
Document Format (1 attachment)
18-M-S-F-E (76).docx
120 KBs Word File