

Question: At = 0.01, test the claim that the 200 test scores shown in the frequency distribution are normally distributed. (a) Find the expected frequencies,
At α = 0.01, test the claim that the 200 test scores shown in the frequency distribution are normally distributed.
(a) Find the expected frequencies,
(b) Find the critical value and identify the rejection region,
(c) Find the chi-square test statistic,
(d) Decide whether to reject or fail to reject the null hypothesis,
(e) Interpret the decision in the context of the original claim.
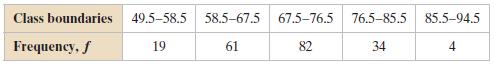
Class boundaries 49.5-58.5 58.5-67.5 67.5-76.5 76.5-85.5 85.5-94.5 19 61 82 34 Frequency, f
Step by Step Solution
3.51 Rating (168 Votes )
There are 3 Steps involved in it
a Frequency distribution 69435 8337 H 0 Test scores have a normal dist... View full answer

Get step-by-step solutions from verified subject matter experts
Document Format (1 attachment)
598-M-S-C-S-T (829).docx
120 KBs Word File