

Question: At a = 0.05, test the claim that the 400 test scores shown in the frequency distribution are normally distributed. Perform a chi-square test for
At a = 0.05, test the claim that the 400 test scores shown in the frequency distribution are normally distributed.
- Perform a chi-square test for normality:
- find the mean and standard deviation of the frequency distribution
- compute the z-score for each class boundary
- use the z-scores to calculate the area under the standard normal curve for each class.
- Multiplying the resulting class areas by the sample size yields the expected frequency for each class.
H0: The variable has a normal distribution.
Ha: The variable does not have a normal distribution.
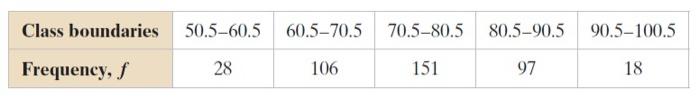
\begin{tabular}{|l|c|c|c|c|c|} \hline Class boundaries & 50.560.5 & 60.570.5 & 70.580.5 & 80.590.5 & 90.5100.5 \\ \hline Frequency, f & 28 & 106 & 151 & 97 & 18 \\ \hline \end{tabular}
Step by Step Solution
There are 3 Steps involved in it
1 Expert Approved Answer
Step: 1 Unlock

Question Has Been Solved by an Expert!
Get step-by-step solutions from verified subject matter experts
Step: 2 Unlock
Step: 3 Unlock