

Color and absorption spectra. Color Plate 15 shows colored solutions and their spectra. From Table 17-1, predict
Question:
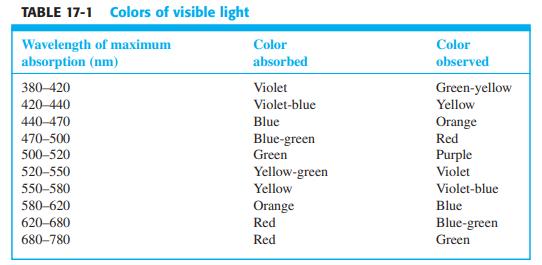
Color and absorption spectra. Color Plate 15 shows colored solutions and their spectra. From Table 17-1, predict the color of each solution from the wavelength of maximum absorption. Do observed colors agree with predicted colors?
Table 17-1
Fantastic news! We've Found the answer you've been seeking!
Step by Step Answer:
Curve A B D E F Absorption peak nm 760 ...View the full answer

Answered By
Ann Wangechi
hey, there, paying attention to detail is one of my strong points, i do my very best combined with passion. i enjoy researching since the net is one of my favorite places to be and to learn. i am a proficient and versatile blog, article academic and research writing i possess excellent English writing skills, great proof-reading. i am a good communicator and always provide feedback in real time. i'm experienced in the writing field, competent in computing, essays, accounting and research work and also as a Database and Systems Administrator
151+ Reviews
291+ Question Solved
Related Book For 

Question Posted:
