

Question: Consider the following information: Each unit sells for $500. Regular production and overtime production costs are $350 and $450 per unit, respectively. The cost to
Consider the following information: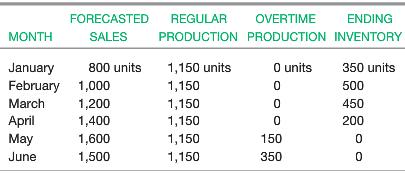 Each unit sells for $500. Regular production and overtime production costs are $350 and $450 per unit, respectively.
The cost to hold a unit in inventory for one month is $10.
a. Develop a cash flow analysis for this problem. Be sure to calculate net cash flow and cumulative net cash flow for each month.
b. Why do the net cash flows for April and May look so much better than those for the other months? What are the implications for building up and draining down inventories under a level production plan?
FORECASTED REGULAR OVERTIME ENDING MONTH SALES PRODUCTION PRODUCTION INVENTORY O units January February 1,000 1,200 800 units 1,150 units 350 units 1,150 500 1,150 1,150 March 450 April May 1,400 200 1,600 1,500 1,150 150 June 1,150 350
Step by Step Solution
3.41 Rating (179 Votes )
There are 3 Steps involved in it
tr msoheightsourceauto col msowidthsourceauto br msodataplacementsamecell style16 msonumberformat00220022 00000220022 00000220022 00220022 msostylenameCurrency msostyleid4 style0 msonumberformatGenera... View full answer

Get step-by-step solutions from verified subject matter experts
Document Format (1 attachment)
436-B-M-L-S-C-M (2757).xlsx
300 KBs Excel File