

Question: Re-create the S&OP spread sheet used in Table 10.10 and Example 10.11. (You do not have to build in the optimization model using the Solver
Re-create the S&OP spread sheet used in Table 10.10 and Example 10.11. (You do not have to build in the optimization model using the Solver function.) While your formatting may differ, your answers should be the same. Your spreadsheet should generate new results any time any of the planning, sales forecast, or hiring/layoff values are changed. To test your spreadsheet, change the planning values to match the following: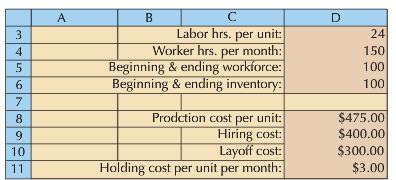 If your spreadsheet works correctly, the new total cost for a level production plan should be $5,769,100, and for a chase production plan, it should be $5,755,600.
A B C Labor hrs. per unit: month: 3 24 Worker hrs. per Beginning & ending workforce: Beginning & ending inventory: 4 150 100 100 Prodction cost per unit: Hiring cost: Layoff cost: $475.00 $400.00 $300.00 $3.00 8 10 11 Holding cost per unit per month: 567
Step by Step Solution
3.27 Rating (165 Votes )
There are 3 Steps involved in it
tr msoheightsourceauto col msowidthsourceauto br msodataplacementsamecell style16 msonumberformat 000 000 00220022 msostylenameComma msostyleid3 style17 msonumberformat00220022 00000220022 ... View full answer

Get step-by-step solutions from verified subject matter experts
Document Format (1 attachment)
436-B-M-L-S-C-M (2758).xlsx
300 KBs Excel File