

Question: Consider the time series data shown in Table 9.1. Use an adjusted exponential smoothing model to develop a forecast for the 12 months of 2012.
Consider the time series data shown in Table 9.1. Use an adjusted exponential smoothing model to develop a forecast for the 12 months of 2012. (Assume that the un-adjusted forecast and trend factor for January are 220,000 and 10,000, respectively.) How do your results compare to the regression model results shown in Table 9.12?
Cooper Toys sells a portable baby stroller called the Tot n’ Trot. The past two years of demand for Tot n’ Trots are shown in the following table. Use this information for problems 19 and 20.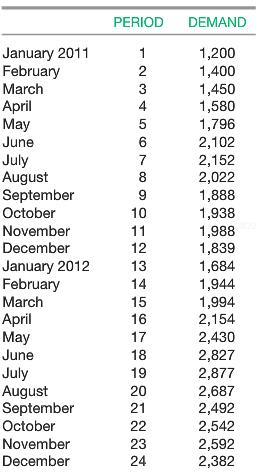
PERIOD DEMAND January 2011 February March 1 1,200 1,400 1,450 1,580 1,796 3 April May June 4 5 6 2,102 2,152 2,022 1,888 1,938 1,988 1,839 1,684 July August September October 7 8 9 10 November 11 December 12 January 2012 February March 13 14 1,944 1,994 2,154 2,430 2,827 2,877 2,687 2,492 15 April May June 16 17 18 July August September October 19 20 21 22 2,542 2,592 2,382 November 23 December 24
Step by Step Solution
3.31 Rating (169 Votes )
There are 3 Steps involved in it
tr msoheightsourceauto col msowidthsourceauto br msodataplacementsamecell style0 msonumberformatGeneral textaligngeneral verticalalignbottom whitespac... View full answer

Get step-by-step solutions from verified subject matter experts
Document Format (1 attachment)
436-B-M-L-S-C-M (2733).xlsx
300 KBs Excel File