

Question: Consider the time series data shown in the following table. Use an adjusted exponential smoothing model to develop a forecast for the months of 2019.
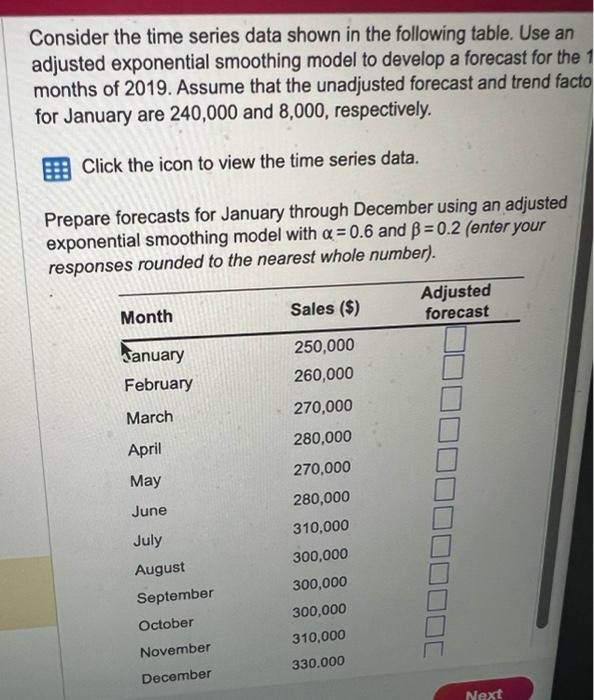
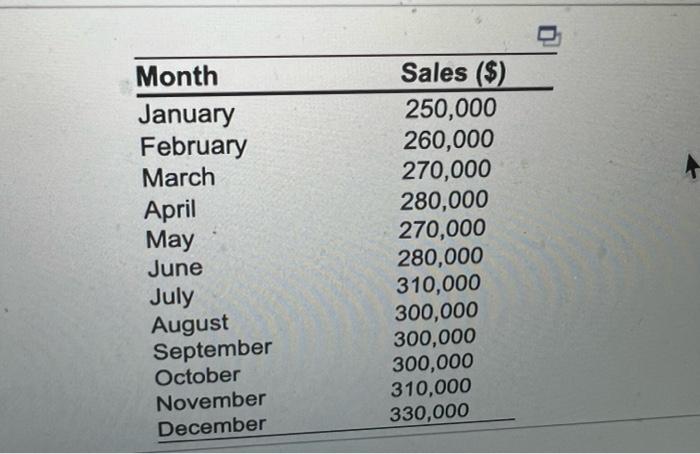
Consider the time series data shown in the following table. Use an adjusted exponential smoothing model to develop a forecast for the months of 2019. Assume that the unadjusted forecast and trend factc for January are 240,000 and 8,000 , respectively. Click the icon to view the time series data. Prepare forecasts for January through December using an adjusted exponential smoothing model with =0.6 and =0.2 (enter your responses rounded to the nearest whole number). \begin{tabular}{ll} \hline Month & Sales (\$) \\ \hline January & 250,000 \\ February & 260,000 \\ March & 270,000 \\ April & 280,000 \\ May & 270,000 \\ June & 280,000 \\ July & 310,000 \\ August & 300,000 \\ September & 300,000 \\ October & 300,000 \\ November & 310,000 \\ December & 330,000 \\ \hline \end{tabular}
Step by Step Solution
There are 3 Steps involved in it

Get step-by-step solutions from verified subject matter experts