

Question: Ferragosto Services, Ltd. provided the following comparative balance sheets and income statement for the current year. Ferragosto Services, Ltd. Income Statement For the Year Ended
Ferragosto Services, Ltd. provided the following comparative balance sheets and income statement for the current year.
Ferragosto Services, Ltd.
Income Statement
For the Year Ended December, 31
Current Year
Service Revenue……………………………………….. $ 707,475
Selling, General, and Administrative Expenses………... (280,100)
Depreciation Expense…………………………………... (75,900)
Bad Debt Expense……………………………………… (20,000)
Income before Interest and Taxes………………………. $ 331,475
Interest Expense………………………………………… (25,000)
Income before Tax………………………………………. $ 306,475
Tax at 40%......................................................................... (122,590)
Net Income……………………………………………… $ 183,885
Additional Information:
1. Ferragosto included the $ 24,150 loss on disposal of investments in Selling, General, and Administrative Expenses on the income statement.
2. Accrued liabilities relate to Selling, General and Administrative Expenses.
3. All dividends declared are paid in cash.
4. All interest and taxes are paid in cash.
5. Acquisitions of land and property, plant and equipment used cash only.
Required
Prepare Ferragosto’s cash flow statement for the current year under the indirect method. Assume accrued liabilities relate to Selling, General and Administrative Expenses
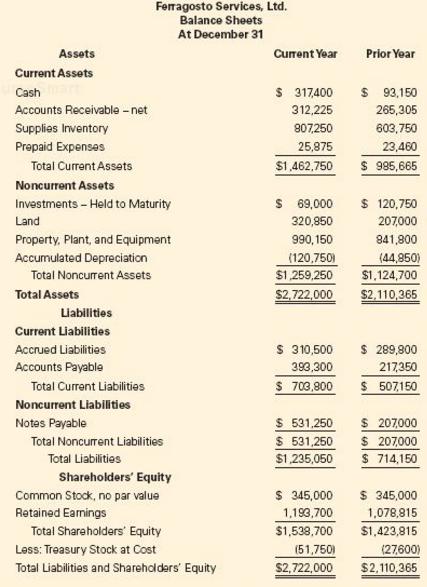
Ferragosto Services, Ltd. Balance Sheets At December 31 Assets Current Year Prior Year Current Assets Cash Accounts Receivable-net Supplies Inventory Prepaid Expenses S 317400 93,150 265,305 603,750 23,460 $1,462,750 985,665 312,225 807250 25,875 Total Current Assets Noncurrent Assets Investments- Held to Maturity Land Property, Plant, and Equipment Accumulated Depreciation s 69,000 120,750 207000 941,800 (44,850 $1 259,250 1,124,700 S2,722,000 $2,110.365 320,850 990,150 Total Noncurrent Assets Total Assets Liabilities Current Liabilities Accrued Liabilities Accounts Payable s 310,500 393,300 S 703,800 S 289,900 217350 507150 Total Current Liabilities Noncurrent Liabilities Notes Payable S 531250 207000 S 531,250 207000 $1,235,050 714,150 Total Noncurrent Liabilities Total Liabilities Shareholders Equity Common Stock, no par value Retained Eanings S 345,000 345,000 1.193,700 1078,815 $1.538,700 $1,423,815 Total Shareholders' Equity Less: Treasury Stock at Cost Total Liabilities and Shareholdars' Equity 51750 $2,722,000 $2,110,365
Step by Step Solution
3.19 Rating (152 Votes )
There are 3 Steps involved in it
The first step in the solution is to isolate all balance sheet changes and classify the changes as operating investing or financing Analysis of Balanc... View full answer

Get step-by-step solutions from verified subject matter experts
Document Format (1 attachment)
578-B-A-B-S-C-F (1959).docx
120 KBs Word File