

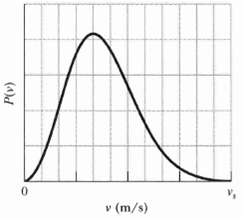
Question: Figure gives the probability distribution for nitrogen gas. The scale of the horizontal axis is set by vs = 1200m/s. What are the (a) Gas
Figure gives the probability distribution for nitrogen gas. The scale of the horizontal axis is set by vs = 1200m/s. What are the
(a) Gas temperature and
(b) Rms speed of themolecules?
v (m/s) (4)d
Step by Step Solution
★★★★★
3.47 Rating (173 Votes )
There are 3 Steps involved in it
1 Expert Approved Answer
Step: 1 Unlock

a From the graph we see that Vp 400 ms Using the ... View full answer
Question Has Been Solved by an Expert!
Get step-by-step solutions from verified subject matter experts
Step: 2 Unlock
Step: 3 Unlock
Document Format (1 attachment)
2-P-T-K-T (252).docx
120 KBs Word File