

Figure shows the position of a car plotted as a function of time. At which times t
Question:
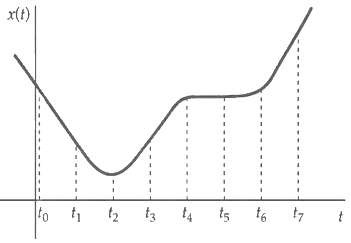
Figure shows the position of a car plotted as a function of time. At which times t0 to t7 is the velocity (a) Negative? (b) Positive? (c) Zero?
At which times is the acceleration (a) Negative? (b) Positive? (c) Zero?
Fantastic news! We've Found the answer you've been seeking!
Step by Step Answer:
Velocity a Negative at t 0 and t 1 b Po...View the full answer

Answered By
Shehar bano
I have collective experience of more than 7 years in education. my area of specialization includes economics, business, marketing and accounting. During my study period I remained engaged with a business school as a visiting faculty member and did a lot of business research. I am also tutoring and mentoring number of international students and professionals online for the last 7 years.
4+ Reviews
10+ Question Solved
Related Book For 

Fundamentals of Ethics for Scientists and Engineers
ISBN: 978-0195134889
1st Edition
Authors: Edmund G. Seebauer, Robert L. Barry
Question Posted:
