

Question: From Exercise 9: The table below shows the proportion of seat belts users by location (urban, suburban, and rural) for automobile passengers/ drivers in the
From Exercise 9: The table below shows the proportion of seat belts users by location (urban, suburban, and rural) for automobile passengers/ drivers in the US based on a survey done for the National Highway Traffic Safety Administration (DOT HS 809 557). Sample sizes are as shown in the right-hand column of the table.
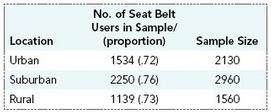
Use the appropriate table format to test the hypothesis that the proportion of seat belt users is the same for the driver/ passenger populations in all three locations— urban, suburban, and rural. Use a significance level of 10%.
No. of Seat Belt Users in Sample/ Location Urban Suburban Rural (proportion Sample Size 1534 (72) 2250 (76) 1139 (73) 2130 2960 1560
Step by Step Solution
3.34 Rating (166 Votes )
There are 3 Steps involved in it
OBSERVED FREQUENCIES Location Seatbelt No Seatbelt TOTAL Urban 722130 1533 597 2130 Suburban 762960 ... View full answer

Get step-by-step solutions from verified subject matter experts
Document Format (1 attachment)
486-M-S-C-S-T (173).docx
120 KBs Word File