

Question: Given the data set (a) Plot the data. (b) Fit a regression line ''through the origin. (c) Plot the regression line on the graph with
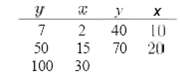
Given the data set
(a) Plot the data.
(b) Fit a regression line ''through the origin."
(c) Plot the regression line on the graph with the data.
(d) Give a general formula for (in terms of the y i and the slope b) the estimator of ?2.
(e) Give a formula for V ar (y i); i = 1, 2. . . n for this case:.
(f) Plot 95% confidence limits Tor the mean response on the graph around the regression line.
40 15 70 20 10 50 100 30
Step by Step Solution
3.46 Rating (172 Votes )
There are 3 Steps involved in it
a The scatter plot of the data is shown next y 100 80 09 40 17 8 5 10 15 y3416... View full answer

Get step-by-step solutions from verified subject matter experts
Document Format (1 attachment)
18-M-S-L-R (188).docx
120 KBs Word File