

Question: In a 2012 study, regression analysis was used to explore the possible connection between a firms overall employee satisfaction level and the firms market based
In a 2012 study, regression analysis was used to explore the possible connection between a firm’s overall employee satisfaction level and the firm’s market based economic value. Suppose the data for the study are given in the table below:
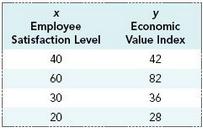
Show the data in a scatter diagram and use the least squares criterion to find the slope (b = ====) and the intercept (a) for the best fitting line. Sketch the least squares line in your scatter diagram. Use the line to predict a company’s economic value index when the company’s employee satisfaction level is 48.
Economic Value Index 42 82 36 Employee Satisfaction Level
Step by Step Solution
★★★★★
3.43 Rating (166 Votes )
There are 3 Steps involved in it
1 Expert Approved Answer
Step: 1 Unlock

x y xy x 2 40 42 1680 1600 60 82 4920 3600 30 36 1080 900 20 28 ... View full answer
Question Has Been Solved by an Expert!
Get step-by-step solutions from verified subject matter experts
Step: 2 Unlock
Step: 3 Unlock
Document Format (1 attachment)
486-M-S-L-R (3035).docx
120 KBs Word File