

Question: Reconstruct the control chart in Exercise 5.36 using = 0.1 and L = 3 for this process. Interpret the results. = 0.05,
Reconstruct the control chart in Exercise 5.36 using λ = 0.1 and L = 3 for this process. Interpret the results.
σ = 0.05, μ0 = 8.02, λ = 0.1 L = 3
In exercise
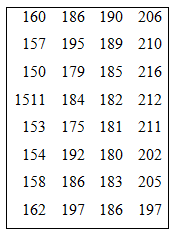
160 186 190 206 157 195 189 210 150 179 185 216 1511 184 182 212 153 175 181 211 154 192 180 202 158 186 183 205 162 197 186 197
Step by Step Solution
★★★★★
3.34 Rating (169 Votes )
There are 3 Steps involved in it
1 Expert Approved Answer
Step: 1 Unlock

MTB Stat Control Charts ... View full answer
Question Has Been Solved by an Expert!
Get step-by-step solutions from verified subject matter experts
Step: 2 Unlock
Step: 3 Unlock
Document Format (1 attachment)
552-M-S-Q-C-B-S (339).docx
120 KBs Word File