

Question: John Thomas. the owner of Thomas Testing, has done some contract work for insurance companies regarding drunk driving_ To Improve his research capabilities, he recently
John Thomas. the owner of Thomas Testing, has done some contract work for insurance companies regarding drunk driving_ To Improve his research capabilities, he recently purchased the Rupple Driving Simulates. This device will allow a subject to take a "road test' and provide a score Indicating the number of driving errors committed during the test drive. Higher scores indicate more driving errors. Driving errors would Include not coming to a complete stop at a stop sign, not using turning signals, not exercising caution on wet or snowy pavement, and so on. During the road test problems appear at random and not all the problems appear in each road test. These are major advantages to the Rupple Driving Simulator because subjects do not gain any advantage by taking the test several times.
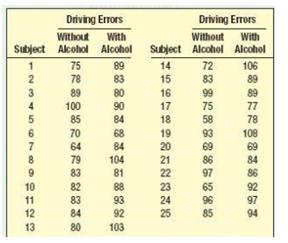
With the new driving stimulator Mr. Thomas would like to study in detail the problem of drunk driving. He begins by selecting a random sample of 25 drivers. He asks each of the selected individuals to take the test drive on the Rupple Driving Simulator_ The number of errors for each driver is recorded. Next, he has each of the individual in the group drink three 16-ounce cans of beer in a 60 minutes period and return to the Rupple Driving Simulator for another test drive. The number of driving errors after drinking the beer is also shown.
The research question is. Does alcohol impair the driver's ability and therefore, increase the number of driving errors?
Mr. Thomas believes the distribution of scores on the test drive does not follow a normal distribution and therefore, a non parametric test should be used. Because the observations are paired, he decides to use both the sign test and the Willcoxon signed-rank test.
a. Compare the results using these two procedures. Conduct an appropriate test of hypothesis to determine the alcohol is related to driving errors.
b. 'Write a report that summarizes your findings.
Driving Errors Driving Errors Without Subject Alcohol Alcohol Without With With Subject Alcohol Alcohol 75 78 89 83 72 83 1 14 106 15 89 3 89 80 16 99 89 100 90 84 17 75 77 85 18 58 78 6. 70 64 79 83 68 84 104 81 19 20 21 22 93 69 86 97 108 69 84 86 7 10 82 88 23 65 92 11 83 93 24 96 97 12 84 92 25 85 94 13 80 103
Step by Step Solution
3.38 Rating (164 Votes )
There are 3 Steps involved in it
Thomas Testing Labs Using the sign test Using the binomial distribution Reje... View full answer

Get step-by-step solutions from verified subject matter experts
Document Format (1 attachment)
356-M-S-N-S (329).docx
120 KBs Word File