

Question: Look at the scatter diagram in Figure. What does it tell you about what was going on in this country in the years 1942 to1945?
Look at the scatter diagram in Figure. What does it tell you about what was going on in this country in the years 1942 to1945?
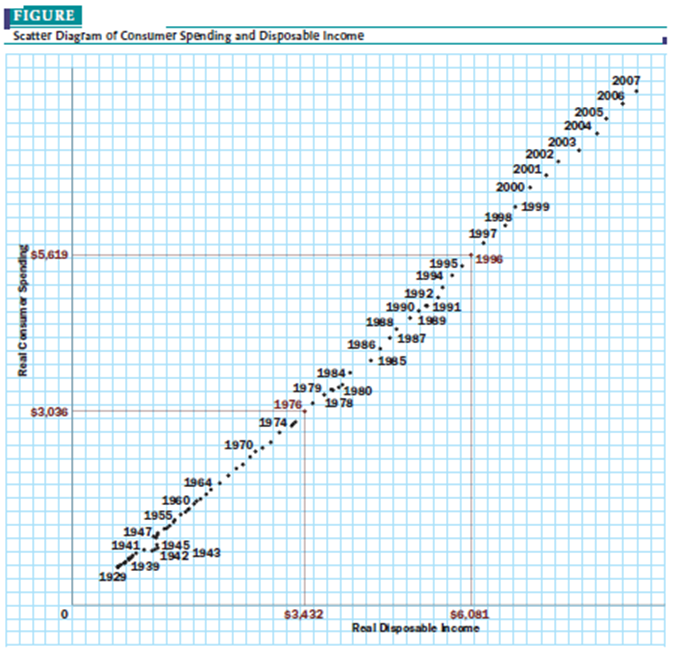
FIGURE Scatter Diagtam of ConsUmer S income 2002 1999 1997 1995. 11996 1992. 1990. 1991 1999 196,1987 1985 1994 1979 1980 1976 1978 1974 1970. 1980 1947 1942 1939 53432 Real Disposable hoome
Step by Step Solution
★★★★★
3.53 Rating (174 Votes )
There are 3 Steps involved in it
1 Expert Approved Answer
Step: 1 Unlock

In 194245 during the Second World War consumption ... View full answer
Question Has Been Solved by an Expert!
Get step-by-step solutions from verified subject matter experts
Step: 2 Unlock
Step: 3 Unlock
Document Format (1 attachment)
165-B-E-M-E (66).docx
120 KBs Word File