

Question: Look back at the calculation for Coca-Cola and Reebok in Section 8.1. Recalculate the expected portfolio return and standard deviation for different values of x
Look back at the calculation for Coca-Cola and Reebok in Section 8.1. Recalculate the expected portfolio return and standard deviation for different values of x1 and x2, assuming the correlation coefficient ?12 = 0. Plot the range of possible combinations of expected return and standard deviation as in Figure 8.4. Repeat the problem for ?12 = +1 and for ?12 = ?1.
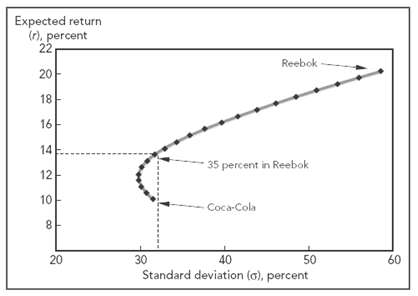
Expected return (r), percent 22 Reebok 20 18 16 14 35 percent in Reebok 12- 10 Coca-Cola 20 30 40 50 60 Standard deviation (a), percent
Step by Step Solution
3.41 Rating (170 Votes )
There are 3 Steps involved in it
In the following solution security one i... View full answer

Get step-by-step solutions from verified subject matter experts
Document Format (1 attachment)
35-B-C-F-R-A-R (125).docx
120 KBs Word File