New Semester
Started
Get
50% OFF
Study Help!
--h --m --s
Claim Now
Question Answers
Textbooks
Find textbooks, questions and answers
Oops, something went wrong!
Change your search query and then try again
S
Books
FREE
Study Help
Expert Questions
Accounting
General Management
Mathematics
Finance
Organizational Behaviour
Law
Physics
Operating System
Management Leadership
Sociology
Programming
Marketing
Database
Computer Network
Economics
Textbooks Solutions
Accounting
Managerial Accounting
Management Leadership
Cost Accounting
Statistics
Business Law
Corporate Finance
Finance
Economics
Auditing
Tutors
Online Tutors
Find a Tutor
Hire a Tutor
Become a Tutor
AI Tutor
AI Study Planner
NEW
Sell Books
Search
Search
Sign In
Register
study help
mathematics
statistics
Business Statistics For Contemporary Decision Making 8th Edition Black Ken - Solutions
Use the Tukey-Kramer procedure to determine whether there is a significant difference between the means of groups 2 and 5 in problem 11.6. Let α = .01.
Using the results from problem 11.7, compute a Tukey’s HSD to determine whether there are any significant differences between group means. Let α = .01.
Using problem 11.8, compute Tukey’s HSD and determine whether there is a significant difference in means by using this methodology. Let α = .05.1 .. 227 ... 2231 ... 2731 ... 2529 ... 2330 ... 2627 ... 2728 ... 23
Use the Tukey-Kramer procedure to do multiple comparisons for problem 11.11. Let α = .01 State which pairs of machines, if any, produce significantly different mean fills.
Use Tukey€™s HSD test to compute multiple comparisons for the data in problem 11.12. Let α = .01. State which regions, if any, are significantly different from other regions in mean starting salaryfigures?
Using α = .05 compute critical values using the Tukey-Kramer procedure for the pair wise groups in problem 11.13. Determine which pairs of groups are significantly different, if any.
Do multiple comparisons on the data in problem 11.14 using Tukey€™s HSD test and α = .05State which pairs of cities, if any, have significantly different meancosts.
Problem 11.16 analyzed the number of weekly hours worked per person at five different plants. An F value of 3.10 was obtained with a probability of .0266. Because the probability is less than .05, the null hypothesis is rejected at α = .05 There is an overall difference in the mean
Use ANOVA to analyze the data from the randomized block design given here. Let α = .05. State the null and alternative hypotheses and determine whether the null hypothesis isrejected.
The following data were gathered from a randomized block design. Use α = .01 to test for a significant difference in the treatment levels. Establish the hypotheses and reach a conclusion about the nullhypothesis.
A randomized block design has a treatment variable with six levels and a blocking variable with 10 blocks. Using this information and α = .05, complete the following table and reach a conclusion about the nullhypothesis.
A randomized block design has a treatment variable with four levels and a blocking variable with seven blocks. Using this information and α = .01 complete the following table and reach a conclusion about the nullhypothesis.
Safety in motels and hotels is a growing concern among travelers. Suppose a survey was conducted by the National Motel and Hotel Association to determine U.S. travelers €˜perception of safety in various motel chains. The association chose four different national chains from the economy
In recent years, the debate over the U.S. economy has been constant. The electorate seems somewhat divided as to whether the economy is in a recovery or not. Suppose a survey was undertaken to ascertain whether the perception of economic recovery differs according to political affiliation. People
As part of a manufacturing process, a plastic container is supposed to be filled with 46 ounces of saltwater solution. The plant has three machines that fill the containers. Managers are concerned that the machines might not be filling the containers with the same amount of saltwater solution, so
The comptroller of a company is interested in determining whether the average length of long-distance calls by managers varies according to type of telephone. A randomized block design experiment is set up in which a long-distance call by each of five managers is sampled for four different types of
Complete the following two-way ANOVA table. Determine the critical table F values and reach conclusions about the hypotheses for effects. Let α =.05.
Complete the following two-way ANOVA table. Determine the critical table F values and reach conclusions about the hypotheses for effects. Let α =.05.
The data gathered from a two-way factorial design follow. Use the two-way ANOVA to analyze these data. Let α =.01.
Suppose the following data have been gathered from a study with a two-way factorial design. Use α = .05 and a two-way ANOVA to analyze the data. State yourconclusions.
Children are generally believed to have considerable influence over their parents in the purchase of certain items, particularly food and beverage items. To study this notion further, a study is conducted in which parents are asked to report how many food and beverage items purchased by the family
A shoe retailer conducted a study to determine whether there is a difference in the number of pairs of shoes sold per day by stores according to the number of competitors within a 1-mile radius and the location of the store. The company researchers selected three types of stores for consideration
Study the following analysis of variance table produced by using Minitab. Describe the design (number of treatments, sample sizes, etc.).Are there any significant effects? Discuss theoutput.
Consider the valve opening data displayed in Table 11.1. Suppose the data represent valves produced on four different machines on three different shifts and that the quality controllers want to know whether there is any difference in the mean measurements of valve openings by shift or by machine.
Compute a one-way ANOVA on the following data. Use α = .05. .If there is a significant difference in treatment levels; use Tukey€™s HSD to compute multiple comparisons. Let α = .05 for the multiplecomparisons.
Compute a one-way ANOVA on the following data. Let α = .01. Use the Tukey-Kramer procedure to conduct multiple comparisons for themeans.
Complete the following ANOVA table and determine whether there is any significant difference in treatment effects. Let α =.05.
Analyze the following data, gathered from a randomized block design using α = .05. If there is a significant difference in the treatment effects, use Tukey€™s HSD test to do multiplecomparisons.
A two-way ANOVA has been computed on a factorial design. Treatment 1 has five levels and treatment 2 has two levels. Each cell contains four measures. Complete the following ANOVA table. Use α = .05 to test to determine significance of the effects. Comment on yourfindings.
Compute a two-way ANOVA on the following data (α =.01).
A company conducted a consumer research project to ascertain customer service ratings from its customers. The customers were asked to rate the company on a scale from 1 to 7 on various quality characteristics. One question was the promptness of company response to a repair problem. The following
A major automobile manufacturer wants to know whether there is any difference in the average mileage of four different brands of tires (A, B, C, and D), because the manufacturer is trying to select the best supplier in terms of tire durability. The manufacturer selects comparable levels of tires
Agricultural researchers are studying three different ways of planting peanuts to determine whether significantly different levels of production yield will result. The researchers have access to a large peanut farm on which to conduct their tests. They identify six blocks of land. In each block of
The Construction Labor Research Council lists a number of construction labor jobs that seem to pay approximately the same wages per hour. Some of these are bricklaying, iron working, and crane operation. Suppose a labor researcher takes a random sample of workers from each of these types of
Why are mergers attractive to CEOs? One of the reasons might be a potential increase in market share that can come with the pooling of company markets.Suppose a random survey of CEOs is taken, and they are asked to respond on a scale from 1 to 5 (5 representing strongly agree) whether increase in
Are some office jobs viewed as having more status than others? Suppose a study is conducted in which eight unemployed people are interviewed. The people are asked to rate each of five positions on a scale from 1 to 10 to indicate the status of the position, with 10 denoting most status and 1
Analyze the following Minitab output. Describe the design of the experiment. Using α = .05 determine whether there are any significant effects; if so, explain why. Discuss any other ramifications of theoutput.
Following is Excel output for an ANOVA problem. Describe the experimental design. The given value of alpha was .05.Discuss the output in terms of significantfindings.
Study the following Minitab output and graph. Discuss the meaning of theoutput.
Interpret the following Excel output. Discuss the structure of the experimental design and any significant effects. Alpha is.05.
Study the following Minitab output. Determine whether there are any significant effects and discuss the results. What kind of design was used and what was the size ofit?
Discuss the following Minitaboutput.
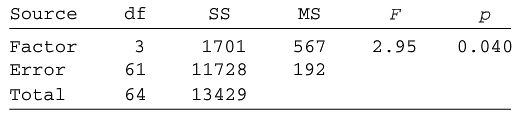
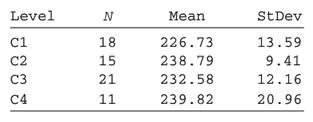
Shown here is the Minitab output for a one-way ANOVA. Analyze the results. Include the number of treatment levels, the sample sizes, the F value, the overall statistical significance of the test, and the values of the means. One-Way Analysis of VarianceAnalysis of VarianceIndividual 95% CIs for
A completely randomized design has been analyzed by using a one-way ANOVA. There are four treatment groups in the design, and each sample size is six.MSE is equal to 2.389.Using α = .05 compute Tukey’s HSD for this ANOVA.
Describe the following factorial design. How many independent and dependent variables are there? How many levels are there for each treatment? If the data were known, could interaction be determined from this design? Compute all degrees of freedom. Each data value is represented by anx.
Describe the following factorial design. How many independent and dependent variables are there? How many levels are there for each treatment? If the data were known, could interaction be determined from this design? Compute all degrees of freedom. Each data value is represented by anx.
Complete the following ANOVAtable.
You are asked to analyze a completely randomized design that has six treatment levels and a total of 42 measurements. Complete the following table, which contains some information from thestudy.
Examine the structure of the following experimental design. Determine which of the three designs presented in the chapter would be most likely to characterize this structure. Discuss the variables and the levels of variables. Determine the degrees offreedom.
In 1950, J. R. Clarkson founded a family-owned industrial valve design and manufacturing company in Sparks, Nevada. For almost a half century, the company, known as the Clarkson Company, worked on advancing metal and mineral processing. The Clarkson Company became known for its knife-gate and
Determine the value of the coefficient of correlation, r, for the followingdata.
Determine the value of r for the followingdata.
In an effort to determine whether any correlation exists between the prices of stocks of airlines, an analyst sampled six days of activity of the stock market. Using the following prices of Delta stock and Southwest stock, compute the coefficient of correlation. Stock prices have been rounded off
The following data are the claims (in $ millions) for BlueCross BlueShield benefits for nine states, along with the surplus (in $ millions) that the company had in assets in those states.Use the data to compute a correlation coefficient, r, to determine the correlation between claims and surplus.
The National Safety Council released the following data on the incidence rates for fatal or lost-work time injuries per 100 employees for several industries in three recent years.Compute r for each pair of years and determine which years are most highly correlated.
Sketch a scatter plot from the following data, and determine the equation of the regressionline.
Sketch a scatter plot from the following data, and determine the equation of the regressionline.
A corporation owns several companies. The strategic planner for the corporation believes dollars spent on advertising can to some extent be a predictor of total sales dollars. As an aid in long-term planning, she gathers the following sales and advertising information from several of the companies
Investment analysts generally believe the interest rate on bonds is inversely related to the prime interest rate for loans; that is, bonds perform well when lending rates are down and perform poorly when interest rates are up. Can the bond rate be predicted by the prime interest rate? Use the
Is it possible to predict the annual number of business bankruptcies by the number of firm births (business starts) in the United States? The following data, published by the U.S. Small Business Administration, Office of Advocacy, are pairs of the number of business bankruptcies (1000s) and the
It appears that over the past 50 years, the number of farms in the United States declined while the average size of farms increased. The following data provided by the U.S. Department of Agriculture show five-year interval data for U.S. farms. Use these data to develop the equation of a regression
Can the annual new orders for manufacturing in the United States be predicted by the raw steel production in the United States? Shown below are the annual new orders for 10 years according to the U.S. Census Bureau and the raw steel production for the same 10 years as published by the American Iron
Determine the equation of the regression line for the following data, and compute theresiduals.
Solve for the predicted values of y and the residuals for the data in Problem 12.6. The data are provided hereagain:
Solve for the predicted values of y and the residuals for the data in Problem 12.7. The data are provided hereagain:
Solve for the predicted values of y and the residuals for the data in Problem 12.8. The data are provided hereagain:
Solve for the predicted values of y and the residuals for the data in Problem 12.9. The data are provided hereagain:
In problem 12.10, you were asked to develop the equation of a regression model to predict the number of business bankruptcies by the number of firm births. Using this regression model and the data given in problem 12.10 (and provided here again), solve for the predicted values of y and the
The equation of a regression line isAnd the data are as follows.Solve for the residuals and graph a residual plot. Do these data seem to violate any of the assumptions ofregression?
Wisconsin is an important milk-producing state. Some people might argue that because of transportation costs, the cost of milk increases with the distance of markets from Wisconsin. Suppose the milk prices in eight cities are as follows.Cost of Milk Distance from Madison(Per gallon)
Graph the following residuals, and indicate which of the assumptions underlying regression appear to be in jeopardy on the basis of thegraph.
Graph the following residuals, and indicate which of the assumptions underlying regression appear to be in jeopardy on the basis of thegraph.
Study the following Minitab Residuals Versus Fits graphic for a simple regression analysis. Comment on the residual evidence of lack of compliance with the regressionassumptions.
Determine the sum of squares of error (SSE) and the standard error of the estimate (se) for Problem 12.6. Determine how many of the residuals computed in Problem 12.14 are within one standard error of the estimate. If the error terms are normally distributed, approximately how many of these
Determine the SSE and the se for Problem 12.7.Use the residuals computed in Problem 12.15 (for Problem 12.7) and determine how many of them are within ± 1se and ± 2se. How do these numbers compare with what the empirical rule says should occur if the error terms are normally distributed?
Determine the SSE and the se for Problem 12.8.Think about the variables being analyzed by regression in this problem and comment on the value of se.
Determine the SSE and se for Problem 12.9. Examine the variables being analyzed by regression in this problem and comment on the value of se.
In Problem 12.10, you were asked to develop the equation of a regression model to predict the number of business bankruptcies by the number of firm births. For this regression model, solve for the standard error of the estimate and comment on it.
Use the data from Problem 12.19 and determine these.
Determine the SSE and the se for Problem 12.20. Comment on the size of se for this regression model, which is used to predict the cost of milk.
Determine the equation of the regression line to predict annual sales of a company from the yearly stock market volume of shares sold in a recent year. Compute the standard error of the estimate for this model. Does volume of shares sold appear to be a good predictor of a company€™s
The Conference Board produces a Consumer Confidence Index (CCI) that reflects people’s feelings about general business conditions, employment opportunities, and their own income prospects. Some researchers may feel that consumer confidence is a function of the median household income. Shown here
Test the slope of the regression line determined in Problem 12.6. Use α =.05.
Test the slope of the regression line determined in Problem 12.7. Use α =.01.
Test the slope of the regression line determined in Problem 12.8. Use α = .10.Advertising .... Sales12.5 ...... 1483.7 ...... 5521.6 ...... 33860.0 ...... 99437.6 ...... 5416.1 ...... 8916.8 ...... 12641.2 ...... 379
Test the slope of the regression line determined in Problem 12.9. Use a 5% level of significance.Bond Rate .. Prime Interest Rate5% ....... 16%12 ....... 69 ....... 815 ....... 47 ....... 7
Test the slope of the regression line developed in Problem 12.10. Use a 5% level of significance.Business Bankruptcies Firm Births(1000) ....... (10,000)34.3 ........ 58.135.0 ........ 55.438.5 ........ 57.040.1 ........ 58.535.5 ........ 57.437.9 ........ 58.0
Study the following analysis of variance table, which was generated from a simple regression analysis. Discuss the F test of the overall model. Determine the value of t and test the slope of the regressionline.
Construct a 95% confidence interval for the average value of y for Problem 12.6. Use x =25.
Construct a 90% prediction interval for a single value of y for Problem 12.7; use x = 100. Construct a 90% prediction interval for a single value of y for Problem 14.2; use x = 130. Compare the results. Which prediction interval is greater? Why?
Construct a 98% confidence interval for the average value of y for Problem 12.8; use x = 20.Construct a 98% prediction interval for a single value of y for Problem 14.3; use x = 20.Which is wider? Why?
Construct a 99% confidence interval for the average bond rate in Problem 12.9 for a prime interest rate of 10%.Discuss the meaning of this confidence interval.Bond Rate .. Prime Interest Rate5% ....... 16%12 ....... 69 ....... 815 ....... 47 ....... 7
Determine the equation of the trend line for the data shown below on U.S. exports of fertilizers to Indonesia over a five-year period provided by the U.S. Census Bureau. Using the trend line equation, forecast the value for the year 2015.Year .. Fertilizer ($ millions)2008 ... 32.12009 ... 28.62010
Shown below are rental and leasing revenue figures for office machinery and equipment in the United States over a seven-year period according to the U.S. Census Bureau. Use these data to construct a trend line and forecast the rental and leasing revenue for the year 2014 using these data.Year
After a somewhat uncertain start, e-commerce sales in the United States have been growing for the past several years. Shown below are quarterly adjusted e-commerce sales figures ($ billions) released by the Census Bureau for the United States over a three-year period. Use these data to determine
Determine the Pearson product-moment correlation coefficient for the followingdata.
Use the following data for parts (a) through (f).a. Determine the equation of the least squares regression line to predict y by x. b. Using the x values, solve for the predicted values of y and the residuals.c. Solve for se.d. Solve for r2.e. Test the slope of the regression line. Use
Use the following data for parts (a) through (g).a. Determine the equation of the simple regression line to predict y from x.b. Using the x values, solve for the predicted values of y and the residuals.c. Solve for SSE.d. Calculate the standard error of the estimate.e. Determine the coefficient of
If you were to develop a regression line to predict y by x, what value would the coefficient of determinationhave?
Showing 10000 - 10100
of 88243
First
94
95
96
97
98
99
100
101
102
103
104
105
106
107
108
Last
Step by Step Answers
.png)
.png)
.png)
.png)
.png)
.png)
.png)
.png)
.png)
.png)
.png)
.png)
.png)
.png)
.png)
.png)
.png)
.png)
.png)
.png)
.png)
.png)
.png)
.png)
.png)
.png)
.png)
.png)
.png)
.png)
.png)
.png)
.png)
.png)
.png)
.png)
.png)
.png)
.png)
.png)
.png)
.png)
.png)
-1.png)
-2.png)
.png)
.png)
.png)
.png)
.png)
.png)
.png)
.png)
.png)
.png)
.png)
.png)
.png)
.png)
.png)
.png)
.png)
.png)
.png)
.png)
.png)

