New Semester
Started
Get
50% OFF
Study Help!
--h --m --s
Claim Now
Question Answers
Textbooks
Find textbooks, questions and answers
Oops, something went wrong!
Change your search query and then try again
S
Books
FREE
Study Help
Expert Questions
Accounting
General Management
Mathematics
Finance
Organizational Behaviour
Law
Physics
Operating System
Management Leadership
Sociology
Programming
Marketing
Database
Computer Network
Economics
Textbooks Solutions
Accounting
Managerial Accounting
Management Leadership
Cost Accounting
Statistics
Business Law
Corporate Finance
Finance
Economics
Auditing
Tutors
Online Tutors
Find a Tutor
Hire a Tutor
Become a Tutor
AI Tutor
AI Study Planner
NEW
Sell Books
Search
Search
Sign In
Register
study help
mathematics
statistics
Business Statistics 3rd Edition Norean Sharpe, Richard Veaux, Paul Velleman - Solutions
The Worldwide Cost of Living Survey published by The Economist provides an index that expresses the cost of living in other cities as a percentage of the New York cost. For example, in 2011, the cost of living index in Tokyo was 161, which means that it was 61% higher than New York. The output
Fortune Magazine publishes the top 100 companies to work for every year. Among the information listed is the percentage growth in jobs at each company. The period from 2009 to 2011 was a difficult one for job growth in the United States. The output below shows the regression of the 2012 job growth
In Exercise 43, we examined the Worldwide Cost of Living Survey cost of living index for the ten most expensive cities, whose 2011 indices range from Singapore€™s 137 to Tokyo€™s 161. Let€™s add the ten least ex-pensive cities to the data. Their 2011 indices range from
In Exercise 44, the company Zappos was omitted. Here is a scatterplot of the data with Zappos plotted as an x:a) In words, what does the outlying point say about Zappos?b) What effect would this point have on the regression, had it been left with the rest of the data?c) Using the data on the DVD,
Many factors may affect fans’ decision to go to a ball game. Is it possible that fans prefer teams with an older pitching staff? a) Examine a scatterplot of Attend/ Game and Pitch Age. Check the conditions for regression. b) Do you think there is a linear association between Attendance and
Ads for a Little League instructional video claimed that the techniques would improve the performances of Little League pitchers. To test this claim, 20 Little Leaguers threw 50 pitches each, and we recorded the number of strikes. After the players participated in the training program, we repeated
Consider again the data in Exercise 29 about the fuel economy and weights of cars.In exerciseA consumer organization has reported test data for 50 car models. We will examine the association between the weight of the car (in thousands of pounds) and the fuel efficiency (in miles per gallon). Use
A data set of 5 observations for Concession Sales per person ($) at a theater and Minutes before the movie begins results in the following estimated regression model: Sales = 4.3 + 0.265 Minutes. The standard error of the regression slope is 0.0454. a) Compute the value of the t- statistic to test
Consider the high school SAT scores data from Exercise 31 once more. The mean Verbal score was 596.30 and the standard deviation was 99.52.a) Find a 90% confidence interval for the mean SAT Math score for all students with an SAT Verbal score of 500.b) Find a 90% prediction interval for the Math
Using the same data provided in Exercise 48, answer the following questions.a) Find the 95% prediction interval for the effectiveness of the video on a pitcher with an initial ability of 33 strikes.b) Do you think predictions made by this regression will be very accurate? Explain.
The analyst in Exercise 28 realized the data were in need of transformation because of the nonlinearity between the variables. Economists commonly take the logarithm of these variables to make the relation-ship more nearly linear, and she did too. (These are base 10 logs.) The dependent variable is
A sample of 61 model-2013 cars from an online information service was examined to see how fuel efficiency (as highway mpg) relates to the cost (Manufacturer€™s Suggested Retail Price in dollars) of cars. Here are displays and computer output:a) State what you want to know, identify the
The great recession of 2008 changed spending and energy use habits worldwide. Based on data collected from the United Nations Millennium Indicators Database related to measuring the goal of ensuring environmental sustainability, investigate the association between energy use (kg oil equivalent per
Here is a scatterplot showing the regression line, 95% confidence intervals, and 95% prediction intervals, using 2012 youth unemployment data for a sample of 33 nations. The response variable is the Male Rate, and the predictor variable is the Female Rate.a) Explain the meaning of the 95%
Here is a scatterplot showing the regression line, 95% confidence intervals, and 95% prediction intervals, using 2011 and 2012 male unemployment data for a sample of 33 nations. The response variable is the 2012-Male Rate, and the predictor variable is the 2011- Male Rate.a) Explain the meaning of
Examine the regression and scatterplot showing the regression line, 95% confidence intervals, and 95% prediction intervals using 2006 and 2010 energy use (kg oil equivalent per $ 1000 GDP) for a sample of 31 countries first examined in Exercise 54. The response variable is 2010 Energy Use.a)
The Internet has revolutionized business and offers unprecedented opportunities for globalization. However, the ability to access the Internet varies greatly among different regions of the world. One of the variables the United Nations collects data on each year is Personal Computers per 100
Spending on credit cards decreases after the Christmas spending season (as measured by amount charged on a credit card in December). The data set on the DVD with the same name as this exercise contains the monthly credit card charges of a random sample of 99 cardholders.a) Build a regression model
A soap manufacturer tested a standard bar of soap to see how long it would last. A test subject showered with the soap each day for 15 days and recorded the Weight (in grams) of the soap after the shower. The resulting regression computer output looks, in part, like this:Find the following facts in
Financial analysts know that January credit card charges will generally be much lower than those of the month before. What about the difference between January and the next month? Does the trend continue? The data set on the DVD contains the monthly credit card charges of a random sample of 99
For the data from Exercise 1, which of the following conditions can you check from the scatterplot? Are satisfied? In exercise Age Rentals 35 .... 9 40 .... 8 50 .... 4 65 .... 3 40 .... 10 30 .... 12 a) Linearity b) Independence c) Equal spread d) Normal population
Here€™s a scatterplot of the % of income spent on food versus household income for respondents to the Cornell National Social Survey:For each of the regression assumptions, state whether it is satisfied, not satisfied, or can€™t be determined from this plot. a) Linearity b)
Here are data from a small bookstore.Number of SalespeopleWorking Sales (in $1000’s)2 ............. 103 ............. 117 ............. 139 ............. 1410 ............. 1810 ............. 2012 ............. 2015 ............. 2216 ............. 2220 ............. 26x̄ = 10.4 .......... y-bar
An analysis of spending by a sample of credit card bank cardholders shows that spending by cardholders in January (Jan) is related to their spending in December ( Dec):The assumptions and conditions of the linear regression seemed to be satisfied and an analyst was about to predict January spending
The data for hard drives in Exercise 6 originally included a 200 GB (0.2 TB) drive that sold for $ 299.00. a) Find the regression line predicting Price from Capacity with this hard drive added. b) What has changed from the original regression equation? c) Is the new point a high leverage point
A beverage company specializing in sales of champagne reports four years of quarterly sales as follows (in millions of $):Quarter Sales ($ M)1 ............122 ............413 ............154 ............485 ............256 ............557 ............238 ............699 ............5110
A company fits a regression to predict monthly Orders over a period of 48 months. The Durbin- Watson statistic on the residuals is 0.875. a) At α = 0.01, using k = 1 and n = 50, what are the values of dL and dU? b) Is there evidence of positive autocorrelation? Explain. c) Is there evidence of
The manager of the concert production company considered in earlier exercises considers the regression of Total Revenue on Ticket Sales (Exercise) and computes the Durbin- Watson statistic, obtaining a value of 0.51. a) Consult Table D in Appendix B using k = 1 and n = 45 and complete the test at
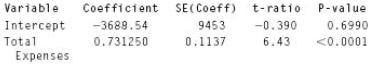
The regression of Total Revenue on Total Expenses for the concerts of Exercise gives the following model:Dependent variable is: Total RevenueR squared = 56.4% R squared (adjusted) = 55.0%s = 24269 with 34 €“ 2 = 32 degrees of freedoma) The Durbin- Watson statistic for this analysis is 0.73.
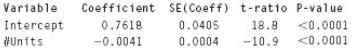
One possible model for the manufacturing process of Exercise is the following:Dependent variable is: Log( Cost per unit)R squared = 90.1% R squared (adjusted) = 89.3%s = 0.0841 with 15 - 2 = 13 degrees of freedomUsing this model, predict the cost per unit in a batch of 300.
A concert production company examined its records. The manager made the following scatterplot. The company places concerts in two venues, a smaller, more in-timate theater (plotted with blue circles) and a larger auditorium- style venue.a) Describe the relationship between Talent Cost and Total
Weddings are one of the fastest growing businesses; about $ 40 billion is spent on weddings in the United States each year. But demographics may be changing, and this could affect wedding retailers€™ marketing plans. Is there evidence that the age at which women get married has changed
Even with campaigns to reduce smoking, Americans still consume more than four packs of cigarettes per month per adult (libraries.ucsd.edu/ssds/pub/(libraries.ucsd.edu/ssds/pub/CTS/tobacco/sales). The Centers for Disease Control and Prevention track cigarette smoking in the United States. How has
The United Nations Development Programme (UNDP) collects data in the developing world to help countries solve global and national development challenges. In the UNDP annual Human Development Report, you can find data on over 100 variables for each of 197 countries worldwide. One summary measure
In justifying his choice of a model, a consultant says “I know this is the correct model because R2 = 99.4%.” a) Is this reasoning correct? Explain. b) Does this model allow the consultant to make accurate predictions? Explain.
An intern who has created a linear model is disappointed to find that her R2 value is a very low 13%. a) Does this mean that a linear model is not appropriate? Explain. b) Does this model allow the intern to make accurate pre-dictions? Explain.
Here€™s a scatterplot of the production budgets (in millions of dollars) vs. the running time (in minutes) for a collection of major movies. Dramas are plot-ted in red and all other genres are plotted in blue. A separate least squares regression line has been fitted to each group. For the
How does what a movie earns relate to its run time? Will audiences pay more for a longer film? Does the relationship depend on the type of film? The scatterplot shows the relationship for the films in Exercise between U. S. Gross earnings and Run Time. Dramas are plotted with purple dots, comedies
Much attention has been paid to the challenges faced by the airline industry. Patterns in customer demand are an important variable to watch. The scatterplot below, created in Excel, shows the number of passengers departing from Oakland ( CA) airport month by month since the start of 1997. Time is
The analyst in Exercise tried fitting the regression line to each market segment separately and found the following:What does this say about her concern in Exercise 1? Was she justified in worrying that the overall model Jan = $612.07 + 0.403 Dec might not accurately summarize the relationship?
Like many businesses, The National Hurricane Center also participates in a program to improve the quality of data and predictions by government agencies. They report their errors in predicting the path of hurricanes. The following scatterplot shows the trend in 48- hour tracking errors since 1970.
Each of the four scatterplots a€“ d that follow shows a cluster of points and one €œstray€ point. For each, answer questions 1€“ 4:1) In what way is the point unusual? Does it have high leverage, a large residual, or both?2) Do you think that point is
Each of the following scatterplots a€“ d shows a cluster of points and one €œ stray€ point. For each, answer questions 1€“ 4:1) In what way is the point unusual? Does it have high le-verage, a large residual, or both?2) Do you think that point is an
The scatterplot shows five blue data points at the left. Not surprisingly, the correlation for these points is r = 0. Suppose one additional data point is added at one of the five positions suggested below in green. Match each point ( a€“ e) with the correct new correlation from the list
The original five points in Exercise produce a regression line with slope 0. Match each of the green points (a€“ e) with the slope of the line after that one point is added:1) - 0.452) - 0.303) 0.004) 0.055) 0.85
A researcher gathering data for a pharmaceutical firm measures blood pressure and the percentage of body fat for several adult males and finds a strong positive association. Describe three different possible cause-and-effect relationships that might be present.
Published reports about violence in computer games have become a concern to developers and distributors of these games. One firm commissioned a study of violent behavior in elementary- school children. The researcher asked the children’s parents how much time each child spent playing computer
Small businesses must track every expense. A flower shop owner tracked her costs for heating and related it to the average daily Fahrenheit temperature, finding the model Cost = 133 €“ 2.13 Temp. The residuals plot for her data is shown.a) Interpret the slope of the line in this context.
How does the speed at which a car drives affect fuel economy? Owners of a taxi fleet, watching their bottom line sink beneath fuel costs, hired a research firm to tell them the optimal speed for their taxis to drive. Researchers drove a compact car for 200 miles at speeds ranging from 35 to 75
Here€™s a plot showing the federal rate on 3-month Treasury bills from 1950 to 1980, and a regression model fit to the relationship between the Rate (in %) and Years since 1950. (www.gpoaccess.gov/eop/)a) What is the correlation between Rate and Year? b) Interpret the slope and
The concert production company of Exercise made a second scatterplot, this time relating Total Revenue to Ticket Sales.a) Describe the relationship between Ticket Sales and Total Revenue. b) How are the results for the two venues similar? c) How are they different?
In Exercise we looked at the age at which women married as one of the variables considered by those selling wedding services. Another variable of concern is the difference in age of the two partners. The graph shows the ages of both men and women at first marriage. (www.census.gov)Clearly, the
In Exercise you investigated the federal rate on 3-month Treasury bills between 1950 and 1980. The scatterplot below shows that the trend changed dramatically after 1980, so we€™ve built a new regression model that includes only the data since 1980 (from x = 30 and on in the plot
Has the trend of de-creasing difference in age at first marriage seen in Exercise gotten stronger recently? Here are the scatterplot and residual plot for the data from 1975 through 2011, along with a regression for just those years.Dependent variable is: Men €“ Women R- squared = 51.9% s
A real estate agent collects data to develop a model that will use the Size of a new home (in square feet) to predict it’s Sale Price (in thousands of dollars). Which of these is most likely to be the slope of the regression line: 0.008, 0.08, 0.8, or 8? Explain.
The home retail industry experienced relatively consistent annual growth until the economic cri-sis of 2006. Here is a scatterplot of the Net Sales ($ B) of The Home Depot from 1995 through 2004, along with a regression and a time series plot of the residuals.a) What does the R2 value in the
For each of the models listed below, predict y when x = 2. a. y-hat = 1.2 + 0.8x b. In y-hat = 1.2 + 0.8x c. y-hat = 1.2 + 0.8x d. 1/y = 1.2 + 0.8x e. y-hat = 1.2x0.8
Here are the data from the small bookstore we saw in chapter 15, Exercise,The regression line is: Sales = 8.10 + 0.913 number of sales people working and we can assume that the assumptions and conditions for regression are met. Calculations with technology find that se = 1.477. a) Find the
For each of the models listed below, predict y when x = 2.a. y-hat = 1.2 + 0.8 log xb. log y-hat = 1.2 + 0.8xc. y-hat = 1.2 + 0.8√xd. y-hat = 1.2 (0.8x)e. y-hat = 0.8x2 + 1.2x + 1
Find the predicted value of y, using each model for x = 10. a) y-hat = 2 + 0.8 ln x b) log y-hat = 5 – 0.23x c) 1/√y-hat = 17.1 – 1.66x
Find the predicted value of y, using each model when x = 4. a) y-hat = 10 + √x b) 1/y-hat = 14.5 – 3.45x c) √y-hat = 3.0 – 0.5x
According to the Maine Department of Marine Resources, in 2012 more than 126,000,000 pounds of lobster were landed in Maine€” a catch worth more than $ 338.9M. The lobster fishing industry is carefully con-trolled and licensed, and facts about it have been recorded for more than a
Here€™s a regression model relating the logValue of the annual Maine lobster catch to the number of licensed lobster Fishers since 1985:a) The number of licensed lobster fishers has fluctuated over the years between roughly 5000 and 10,000. Recently the number has been just over 7000. But
Of course, what matters most to the individual entrepreneur€”the licensed commercial lobster fisher€”is the price of lobster. Here€™s an analysis relating that price ($/lb) to the number of traps (millions) since 1950:a) Are the assumptions and conditions for
Many professions use tables to determine key quantities. The value of a log is based on the number of board feet of lumber the log may contain. (A board foot is the equivalent of a piece of wood 1 inch thick, 12 inches wide, and 1 foot long. For example, a 2 × 4 piece that is 12 feet long
Here are prices for the external disk drives we saw in Chapter 15, exercise 10:The least squares line is Price = 15.11 + 62.417 capacity. The assumptions and conditions for regression are met. SE (b1) = 11.33 and se = 42.04 a) Disk drives keep growing in capacity. Some teach experts now talk about
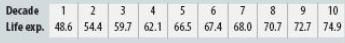
Life insurance rates are based on life expectancy values compiled for large demographic groups. But with improvements in medical care and nutrition, life expectancies have been changing. Here is a table from the National Vital Statistics Report that gives the Life Expectancy for white males in the
The Organization for Economic Cooperation and Development (OECD) is an organization comprised of thirty countries. To belong, a country must sup-port the principles of representative democracy and a free market economy. How have these countries grown in the decade from 1988 to 1998€“
Orange growers know that the larger an orange the higher the price it will bring. But as the number of oranges on a tree increases, the fruit tends to be smaller. Here€™s a table of that relationship. Create a model for this relationship, and express any concerns you may have.
In Exercise 23 we saw that the United Nations Development Programme (UNDP) uses the Human Development Index (HDI) in an attempt to summarize the progress in health, education, and economics of a country with one number. The gross domestic product per capita (GDPPC) attempts to summarize the wealth
In Exercise 63 we examined the relationship between log(GDPPC) and HDI. The number of Internet users (per 1000 people) is also positively associated with economic progress in a country. Here€™s a scatterplot of Internet users (subscribers per 1000 people) against HDI:a) Internet Users is
A regression of Total Revenue on Ticket Sales by the con-cert production company of Exercises 2 and 4 finds the model Revenue = - 14,228 + 36.87 Ticket Sales a) Management is considering adding a stadium-style venue that would seat 10,000. What does this model predict that revenue would be if the
The production company of Exercise 7 offers advanced sales to €œFrequent Buyers€ through its website. Here€™s a relevant scatterplot:One performer refused to permit advanced sales. What ef-fect has that point had on the regression to model Total Revenue from Advanced
The bookstore in Exercise decides to have a gala event in an attempt to drum up business. They hire 100 employees for the day and bring in a total of $ 42,000. a) Find the regression line predicting Sales from Number of people working with the new point added. b) What has changed from the original
A house in the upstate New York area from which the chapter data was drawn has 2 bedrooms and 1000 square feet of living area. Using the multiple regression model found in the chapter, Price = 20,986.09 - 7483.10Bedrooms + 93.84Living Area. a) Find the price that this model estimates. b) The house
In the regression model of Exercise 3, a) What is the R2 for this regression? What does it mean? b) Why is the “Adjusted R Square” in the table different from the “R Square”?
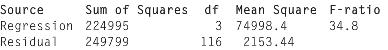
Here is another part of the regression output for the movies in Exercise 3:a) Using the values from the table, show how the value of R2 could be computed. Don€™t try to do the calculation, just show what is computed.b) What is the F-statistic value for this regression?c) What null hypothesis
Is the amount of violent crime related to what police officers are paid? The U.S. Bureau of Labor Statistics publishes data on occupational employment and wage estimates (www.bls.gov/oes/) for each of the 50 states. Here are data released from 2011 to 2013.The variables are:Violent Crime (crimes
On a typical night in New York, about 25,000 people attend a Broadway show, paying an average price of more than $75 per ticket. Variety (www.variety.com), a news weekly that reports on the entertainment industry, publishes statistics about the Broadway show business. The data file on the disk
Here€™s a multiple regression model for the variables considered in Exercise 11.a) Write the regression model. b) What does the coefficient of Police Officer Wage mean in the context of this regression model? c) In a state in which the average police officer wage is $20/hour and the high
Here€™s a multiple regression model for the variables considered in Exercise 12:a) Write the regression model. b) What does the coefficient of Paid Attendance mean in this regression? Does that make sense? c) In a week in which the paid attendance was 200,000 customers attending 30 shows
Using the regression table in Exercise 13, answer the following questions. a) How was the t-ratio of 0.221 found for Police Officer Wage? (Show what is computed using numbers from the table.) b) How many states are used in this model. How do you know? c) The t-ratio for Graduation Rate is negative.
Using the regression table in Exercise 14, answer the following questions. a) How was the t-ratio of 126.7 found for Paid Attendance? (Show what is computed using numbers found in the table.) b) How many weeks are included in this regression? How can you tell? c) The t-ratio for the intercept is
Consider the coefficient of Police Officer Wage in the regression table of Exercise 13. a) State the standard null and alternative hypotheses for the true coefficient of Police Officer Wage. b) Test the null hypothesis (at α = 0.05) and state your conclusion.
Consider the coefficient of # Shows in the regression table of Exercise 14. a) State the standard null and alternative hypotheses for the true coefficient of # Shows. b) Test the null hypothesis (at α = 0.05) and state your conclusion. c) A Broadway investor challenges your analysis. He points out
A candy maker surveyed chocolate bars available in a local supermarket and found the following least squares regression model: Calories = 28.4 + 11.37Fat(g) + 2.91Sugar(g). a) The hand-crafted chocolate she makes has 15g of fat and 20g of sugar. How many calories does the model predict for a
A Senate aide accepts your analysis in Exercise 17 but claims that it demonstrates that if the state pays police more, it will actually increase the rate of violent crime. Explain why this interpretation is not a valid use of this regression model. Offer some alternative explanations.
The investor in Exercise 18 now accepts your analysis but claims that it demonstrates that it doesn’t matter how many shows are playing on Broadway; receipts will be essentially the same. Explain why this interpretation is not a valid use of this regression model. Be specific.
A regression was performed to predict selling Price of houses in dollars from their Area in square feet, Lotsize in square feet, and Age in years. The R2 is 92%. The equation from this regression is given here. Price = 169,328 + 35.3 Area + 0.718 Lotsize - 6543 Age One of the following
Many factors affect the price of wine, including such qualitative characteristics as the variety of grape, location of winery, and label. Researchers developed a regression model considering two quantitative variables: the tasting score of the wine and the age of the wine (in years) when released
A household appliance manufacturer wants to analyze the relationship between total sales and the company’s three primary means of advertising (television, magazines, and radio). All values were in millions of dollars. They found the following regression equation. Sales = 250 + 6.75 TV + 3.5 Radio
Here are some more interpretations of the regression model to predict the price of wine developed in Exercise 24. One of these interpretations is correct. Which is it? Explain what is wrong with the others. a) The minimum price for a bottle of wine that has not aged is $6.25. b) The price for a
What is the financial impact of pollution abatement on small firms? The U.S. government’s Small Business Administration studied this and reported the following model. Pollution abatement>employee = -2.494 - 0.431 Ln(Number of Employees) + 0.698 ln(Sales) Pollution abatement is in dollars per
A study by the U.S. Small Business Administration used historical data to model the GDP per capita of 24 of the countries in the Organization for Economic Cooperation and Development (OECD) (Crain, M. W., The Impact of Regulatory Costs on Small Firms, available at www.sba.gov/advocacy/7540/49291).
Many variables have an impact on determining the price of a house. A few of these are size of the house (square feet), lot size, and number of bathrooms. Information for a random sample of homes for sale in the Statesboro, Georgia, area was obtained from the Internet. Regression output modeling the
Here are some diagnostic plots for the home prices data from Exercise 29. These were generated by a computer package and may look different from the plots generated by the packages you use. (In particular, note that the axes of the Normal probability plot are swapped relative to the plots
The AFL-CIO has undertaken a study of 30 secretaries€™ yearly salaries (in thousands of dollars). The organization wants to predict salaries from several other variables. The variables to be considered potential predictors of salary are:X1 = months of serviceX2 = years of educationX3 =
Here€™s a regression of monthly revenue of Wal-Mart Corp, relating that revenue to the Total U.S. Retail Sales, the Personal Consumption Index, and the Consumer Price Index.Dependent variable is: Wal-Mart_RevenueR squared = 66.7% R squared (adjusted) = 63.8%s = 2.327 with 39 - 4 = 35
The gross domestic product (GDP) is an important measure of the overall economic strength of a country. GDP per capita makes comparisons between different size countries more meaningful. A researcher looking at GDP fit the following model based on an educational variable, Primary School Completion
In Chapter 16, Exercise 53 predicted the annual value of the Maine lobster industry catch from the number of licensed lobser fishers. The lobster industry is an important one in Maine, with annual landings worth about $300,000,000 and employment consequences that extend throughout the
Showing 14800 - 14900
of 88243
First
142
143
144
145
146
147
148
149
150
151
152
153
154
155
156
Last
Step by Step Answers
.png)
.png)
.png)
.png)
.png)
.png)
.png)
.png)
.png)
-1.png)
-2.png)
.png)
.png)
.png)
-1.png)
-2.png)
.png)
.png)
.png)
.png)
.png)
.png)
-1.png)
-2.png)
.png)
.png)
-1.png)
-2.png)
-3.png)
-1.png)
-2.png)
-3.png)
.png)
.png)
.png)
.png)
.png)
.png)
-1.png)
-2.png)
.png)
.png)
.png)
.png)
-1.png)
-2.png)
-3.png)
.png)
.png)
.png)
.png)
.png)
.png)
.png)
.png)
.png)
.png)
.png)
.png)
.png)
-1.png)
-2.png)
.png)
.png)
-1.png)
-2.png)
.png)

