New Semester
Started
Get
50% OFF
Study Help!
--h --m --s
Claim Now
Question Answers
Textbooks
Find textbooks, questions and answers
Oops, something went wrong!
Change your search query and then try again
S
Books
FREE
Study Help
Expert Questions
Accounting
General Management
Mathematics
Finance
Organizational Behaviour
Law
Physics
Operating System
Management Leadership
Sociology
Programming
Marketing
Database
Computer Network
Economics
Textbooks Solutions
Accounting
Managerial Accounting
Management Leadership
Cost Accounting
Statistics
Business Law
Corporate Finance
Finance
Economics
Auditing
Tutors
Online Tutors
Find a Tutor
Hire a Tutor
Become a Tutor
AI Tutor
AI Study Planner
NEW
Sell Books
Search
Search
Sign In
Register
study help
mathematics
statistics
Business Statistics 3rd Edition Norean Sharpe, Richard Veaux, Paul Velleman - Solutions
In Chapter 16, Exercise 54 predicted the price ($/lb) of lobster harvested in the Maine lobster fishing industry. Here€™s a multiple regression to predict the Price from the number of Traps (millions), the number of Fishers, and Pounds/Trap during the years 1957 to 2012.Dependent variable is:
In 1990, the United Nations created a single statistic, the Human Development Index or HDI, to summarize the health, education, and economic status of countries.Using data from 96 countries, here is a multiple regression model trying to predict HDI.Dependent variable is: HDIR squared = 98.23%s =
Wal-Mart is the second largest retailer in the world. The data file on the disk holds monthly data on Wal-Mart’s revenue, along with several possibly related economic variables.a) Using computer software, find the regression equation predicting Wal-Mart revenues from the Retail Index, the
Consider the model you fit in Exercise 37 to predict Wal-Mart’s revenue from the Retail Index, CPI, and Personal Consumption index. a) Plot the residuals against the predicted values and comment on what you see. b) Identify and remove the four cases corresponding to December revenue and find the
An important challenge in clinical trials is patients who drop out before the trial is completed. This can cost pharmaceutical companies millions of dollars because patients who have received a tested treatment for months must be combined with those who received it for a much shorter time. Can we
Are there fundamental differences between liberal arts colleges and universities? In this case, we have information on the top 25 liberal arts colleges and the top 25 universities in the United States. We will consider the type of school as our response variable and will use the percent of students
What can predict how much a motion picture will make? We have data on a number of recent releases that includes the USGross (in $M), the Budget ($M), the Run Time (minutes), and the average number of Stars awarded by reviewers. The first several entries in the data table look like this:We want a
More than one million motorcycles are sold annually (www.webbikeworld.com). Off-road motorcycles (often called €œdirt bikes€) are a market segment (about 18%) that is highly specialized and offers great variation in features. This makes it a good segment to study to learn about
In Exercise 41, we saw data on off-road motorcycles and examined scatterplots. Review those scatterplots. Here€™s a regression of MSRP on both Displacement and Bore. Both of the predictors are measures of the size of the engine. The displacement is the total volume of air and fuel mixture
Here€™s another model for the MSRP of off-road motorcycles.a) Would this be a good model to use to predict the price of an off-road motorcycle if you knew its bore, clearance, and engine strokes? Explain. b) The Suzuki DR650SE had an MSRP of $4999 and a 4-stroke engine, with a bore of 100
The dataset corresponding to the exercise on the DVD holds various measures of the 50 United States. The Murder rate is per 100,000, HS Graduation rate is in %, Income is per capita income in dollars, Illiteracy rate is per 1000, and Life Expectancy is in years. Find a regression model for Life
Like many fast-food restaurant chains, Burger King (BK) provides data on the nutrition content of its menu items on its website. Here€™s a multiple regression predicting calories for Burger King foods from Protein content (g), Total Fat (g), Carbohydrate (g), and Sodium (mg) per
Can the amount of money that a country spends on health (as % of GDP) be predicted by other economic indicators? Here€™s a regression predicting Expenditures on Public Health (as % of GDP) from Expected Years of Schooling and Internet Users (per 100 people):a) Write the regression
A middle manager at an entertainment company, upon seeing the analysis of Exercise 3, concludes that the longer you make a movie, the less money it will make. He argues that his company’s films should all be cut by 30 minutes to improve their gross. Explain the flaw in his interpretation of this
For the movies examined in Exercise 4, here is a scatterplot of USGross vs. Budget:What (if anything) does this scatterplot tell us about the following Assumptions and Conditions for the regression? a) Linearity condition b) Equal Spread condition c) Normality assumption
For the movies regression, here is a histogram of the residuals. What does it tell us about these Assumptions and Conditions?a) Linearity condition b) Nearly Normal condition c) Equal Spread condition
In the regression output for the movies of Exercise 3, a) What is the null hypothesis tested for the coefficient of Stars in this table? b) What is the t-statistic corresponding to this test? c) What is the P-value corresponding to this t-statistic? d) Complete the hypothesis test. Do you reject
a) What is the null hypothesis tested for the coefficient of Run Time in the regression of Exercise 3? b) What is the t-statistic corresponding to this test? c) Why is this t-statistic negative? d) What is the P-value corresponding to this t-statistic? e) Complete the hypothesis test. Do you reject
For each of the following, show how you would code dummy (or indicator) variables to include in a regression model. a) Company unionization status (Unionized, No Union) b) Gender (Female, Male) c) Account Status (Paid on time, Past Due) d) Political party affiliation (Democrat, Republican, Other)
For the same regression as in Exercise 9, the Cook€™s Distances look like this:The outlier, once again, is John Carter, whose budget was more than $200M more than its gross revenue in the U.S. Setting this movie aside and rerunning the regression from Exercise 8, we find: Dependent
An analyst wants to build a regression model to predict spending from the following four predictor variables: Past Spending, Income, Net Worth and Age. A correlation matrix of the four predictors shows:Why might a stepwise regression search not find the same model as an €œall
The analyst in Exercise fits the model with the four predictor variables. The regression output shows:Response Variable: SpendingR2 = 84.92% Adjusted R2 = 84.85%s = 48.45 with 908 - 5 = 903 degrees of freedoma) How many observations were used in the regression? b) What might you do next? c) Is it
The analyst from Exercise, worried about collinearity, regresses Age against Past Spending, Income, and Networth. The output shows:Response Variable: AgeR2 = 98.75% Adjusted R2 = 98.74%s = 2.112 with 908 - 4 = 904 degrees of freedomWhat is the VIF for Age?
If the VIF for Networth in the regression of Exercise 11 was 20.83, what would the R2 be from the regression of Networth on Age, Income, and Past Spending?In exercise
A collection of houses in a neighborhood of Boston shows the following relationship between Price and Age of the house:a) Describe the relationship between Price and Age. Explain what this says in terms of house prices. b) A linear regression of Price on Age shows that the slope for Age is not
A regression model from the collection of houses in Exercise 15 shows the following:a) The slope of Age is negative. Does this indicate that older houses cost less, on average? Explain. b) Why did the model subtract 38.5122 from Age in the quadratic term?
Manufacturers of frozen foods of-ten reformulate their products to maintain and increase customer satisfaction and sales. So they pay particular attention to evaluations of their products in comparison to their competitors€™ products. Frozen pizzas are a major sector of the frozen food
The Texas Transportation Institute (tti.tamu.edu) studies traffic delays. They estimate that in the year 2011, 498 urban areas experienced 5.5 billion vehicle hours of delay, resulting in 2.9 billion gallons of wasted fuel and $121 billion in lost productivity and fuel costs. That€™s
Here€™s a scatterplot of the residuals against predicted values for the regression model found in Exercise.a) The two extraordinary points in the lower right are Reggio€™s and Michelina€™s, two gourmet brands. Interpret these points. b) Do you think these two pizzas
A marketing manager has developed a regression model to predict quarterly sales of his company’s down jackets based on price and amount spent on advertising. An intern suggests that he include an indicator (dummy) variable for the Fall quarter. a) How would you code such a variable? (What values
Here€™s a scatterplot of the residuals from the regression in Exercise 18 plotted against mean Highway mph.a) The point plotted with an x is Los Angeles. Read the graph and explain what it says about traffic delays in Los Angeles and about the regression model. b) Is Los Angeles likely to
Each week about 100 million customers€”nearly one-third of the U.S. population€”visit one of Walmart€™s U.S. stores. How does Walmart€™s revenue relate to the state of the economy in general? Before 2009, Walmart reported sales each month, but since then it
Pedro Martinez, who retired from Major League Baseball in 2012, had a stellar career, helping the Boston Red Sox to their first World Series title in 86 years in 2004. The next year he became a free agent and the New York Mets picked him up for $53 million for 4 years. Even after the move to New
In Exercise 19, we raised questions about two gourmet pizzas. After removing them, the resulting regression looks like this.A plot of the residuals against the predicted values for this regression looks like this. It has been colored according to the Type of pizza. a) What does this plot say about
Here€™s a plot of the Studentized residuals from the regression model of Exercise 18 plotted against ArterialMPH. The plot is colored according to City Size (Small, Medium, Large, and Very Large), and regression lines are fit for each city size.a) The model in Exercise 18 includes
Insurance companies base their premiums on many factors, but basically all the factors are variables that predict life expectancy. Life expectancy varies from place to place. Here€™s a regression that models Life Expectancy in terms of other demographic variables. The variables are Murder
Breakfast cereal manufacturers publish nutrition information on each box of their product. As we saw in Chapter 16, there is a long history of cereals being associated with nutrition. Here€™s a regression to predict the number of Calories in breakfast cereals from their Sodium, Potassium,
The Brief Case in Chapter 4 introduced the Cost of Living dataset that contains an estimate of the cost of living for 322 cities worldwide in 2013. In addition to the overall Cost of Living Index are: the Rent Index, Groceries Index, Restaurant Index, and the Local Purchasing Power Index, which
Cost of Living 2013, revisited. For the first model considered in Exercise 27, with all four predictors in the model, a plot of Leverage values shows the two largest values are Hong Kong (0.18) and Luanda, Angola (0.15).a) By examining the values of their predictor variables find out why these two
In Chapter 17, Exercise 46 we found a model for national Health Expenditures from an economic variable, Internet Users/100 people, and Primary Completion Rate. A look at leverage values and Cook€™s distances identifies several countries as possible high influence points. Here are the
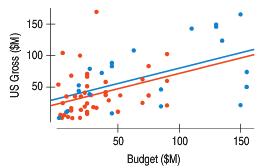
Do movies of different types have different rates of return on their budgets? Here€™s a scatterplot of Gross Revenue in US ($M) vs. Budget ($M) for recent movies whose MPAA Rating is either PG (blue) or R (red):a) Why might a researcher want to use an indicator variable for the MPAA
Off-road motorcycles (often called €œdirt bikes€) are a segment (about 18%) of the growing motorcycle market. Because dirt bikes offer great variation in features, they are a good market segment to study to learn about which features account for the cost
In Exercise we found a model for the gross revenue from U.S. movie theatres for 106 recent movies that were rated either R or PG-13. A plot of residuals against predicted revenue shows:A histogram of the y variable, US Gross shows: a) What assumptions and/or conditions are violated by this
The model in Exercise 30 is missing one predictor that we might have expected to see. Engine Displacement is highly correlated 1r = 0.7832 with MSRP, but that variable has not entered the model (and, indeed, would have a P-value of 0.54 if it were added to the model). Here is some evidence to
In Chapter 17, Exercise 33 we found a model for GDP per Capita from three country characteristics: Cell phones/100 people, Internet Users/100 people, and Primary Completion Rate. A look at leverage values and Cook€™s distance identifies three countries with high leverage (above 0.10) as
In Exercise we saw that there were several potential high influence points. After a researcher set aside those four countries, she refit the model in Exercise 33. A plot of residuals vs. predicted values showed:a) What assumption and/or condition does the model violate? A histogram of GDP per
In Chapter 17, Exercise 36 we found a model for HDI (the UN’s Human Development Index) from 7 socio-economic variables for 96 countries. Using software that provides regression diagnostics (leverage values, Cook’s distance, studentized residuals), find two countries that have potentially large
In Exercise 35 you identified several countries that had potentially large influence on the model in Chapter 17, Exercise 36 predicting HDI. Set those countries aside and rerun the model. Write up a few sentences on the impact that leaving these countries out has on the regression and give your
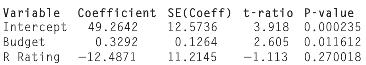
Here is the regression for Exercise 3 with an indicator variable:Dependent variable is: US Gross($M)R-squared = 0.193, Adjusted R-squared: 0.166s = 37.01 with 62 - 3 = 59 degrees of freedoma) Write out the regression model.b) In this regression, the variable R Rating is an indicator variable that
For each of the following, show how you would code dummy (indicator) variables to include in a regression model. a) Type of residence (Apartment, Condominium, Townhouse, Single family home) b) Employment status (Full-time, Part-time, Unemployed)
A marketing manager has developed a regression model to predict quarterly sales of his company’s mid-weight microfiber jackets based on price and amount spent on advertising. An intern suggests that he include indicator (dummy) variables for each quarter. a) How would you code the variables? (How
Are R rated movies as profitable as those rated PG-13? Here€™s scatterplot of US Gross ($M) vs. Budget ($M) for PG-13 (green) and R (purple) rated moviesa) How would you code the indicator variable? (Use PG-13 as the base level.) b) How would you construct the interaction term variable?
Here is the scatterplot of the variables in Exercise 7 with regression lines added for each kind of movie:The regression model is:Dependent variable is: US Gross ($M)R-squared = 0.3674, Adjusted R-squared: 0.3491 s = 58.24 with 107 - 3 = 104 degrees of freedoma) Write out the regression model. b)
Are the following data time series? If not, explain why. a) Quarterly earnings of Microsoft Corp. b) Unemployment in August 2010 by Education level. c) Time spent in training by workers in NewCo. d) Numbers of e- mails sent by employees of SynCo each hour in a single day.
For the Gas prices of Exercise 6, find the lag2 version of the prices.
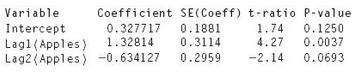
A second- order autoregressive model for the apple prices (for all 4 years of data) isDependent variable is: ApplesR squared = 78.1% R squared (adjusted) = 71.9%s = 0.0574 with 10 - 3 = 7 degrees of freedomUsing the values from the table, what is the predicted value for January 2007 (the value just
A second-order autoregressive model for the gas prices is:Using values from the table, what is the predicted value for January 2007 (the value just past those given in the table)?
An Additive regression model for the Apple prices is:a) What is the name for the kind of variable called Jan in this model? b) Why is there no predictor variable for December?
An additive model for the Gas prices is:a) What is the value predicted by this model for January 2010 (Time = 2010)? b) Do you think the predictions from this model are likely to be accurate? Explain.
a) Which will be smoother, a 50-day or a 200-day moving average? b) Which will be smoother, a single exponential smoothing (SES) model using α = 0.10 or a model using α = 0.80? c) What is the difference in how historical data are used when the smoothing coefficient in a single exponential
We are trying to forecast monthly sales for a company that sells ski equipment and clothing. Assume that the company’s sales peak each December and that the monthly sales have been growing at the rate of 1% each month. Answer the following questions. a) Based on the description of these data,
For each of the following time series, suggest an appropriate model: a) Weekly stock prices that reveal erratic periods of up and down swings. b) Annual sales that reveal a consistent percentage annual increase. c) Quarterly sales for a bicycle shop that reveal a seasonal pattern where sales
For each of the following time series, suggest an appropriate model: a) Daily stock prices that reveal erratic periods of up and down swings. b) Monthly sales that reveal a consistent percentage increase from month to month. c) Quarterly sales for a woman’s clothing company that reveal an
The Bank of New York Company was founded by Alexander Hamilton in 1784 and was a major commercial bank until its merger with the Mellon Financial Corporation in 2007. Their year- end financial reports for the final five years of independent operation give the following values for their liquid
Are the following data time series? If not, explain why. a) Reports from the Bureau of Labor Statistics on the number of U.S. adults who are employed full- time in each major sector of the economy. b) The quarterly Gross Domestic Product (GDP) of France from 1980 to the present. c) The dates on
Sara Lee Corp., maker of food, beverage, and household products, is known especially for its baked products, marketed under its corporate name. For the five years ending July 1 of each year from 2002 to 2006, their bakery division reported the following profits.Fiscal Year Profits ($ M)2002
The price of bananas fluctuates on the world market. Here are the prices ($/tonne) for the years 2000€“2004.a) Find a 3- year moving average prediction for the price in 2005.b) Find a prediction for 2005 with an exponential smoothing model with a = 0.4.c) The actual price of bananas in 2005 was
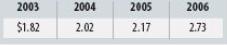
Target Corp. operates €œbig box€ stores that sell everyday essentials and fashionable differentiated merchandise. It also operates an online business at target.com. Target€™s reported gross earnings per share for the years 2003€“2006 are given here.a) Find a prediction for 2007 based
Suppose an autoregressive model is used for data in which quarterly sales in 2013 were: 1.9, 1.7, 2.2, and 2.3 ($ Billion). a) If a first-order autoregressive model is developed with estimated parameters of b0 = 0.100 and b1 = 1.12, compute the forecast for Q1 of 2014. b) Compare this forecast to
Suppose an autoregressive model is used to model sales for a company that peaks twice per year (in June and December). a) What lagged variables would you try in a regression to forecast sales? Explain. b) How would you determine which of your lagged variables should remain in the model? Explain.
Coffee is the world€™s second largest legal export commodity (after oil) and is the second largest source of foreign exchange for developing nations. The United States consumes about one-fifth of the world€™s coffee. The International Coffee Organization (ICO) computes a coffee
The Gallup organization periodically asks the following question: If your party nominated a generally well-qualified person for president who happened to be a woman, would you vote for that person? Here is a time series plot of the percentage answering €œyes€ versus the year of
The most common use of the CPI is as an economic indicator to forecast inflation and evaluate the effectiveness of government policies. Following is the time series plot for the monthly CPI (not seasonally adjusted) from January 2007 to May 2013. The linear trend line is: CPI = 206 + 0.346 t, where
In Exercise 30 we looked at the weekly average retail price (cents per gallon) of regular gas nationwide from 2011 through June 2013. Here€™s the time series plot again:a) What components can you see in this plot? Here€™s an AR(14) model fit to these data. Here€™s a
Average annual interest rates (banks prime lending) in the United States from 1966 through 2009 are shown in the following time series graph.a) What components do you see in this series? Here€™s an autoregressive model with a 13-week lag fit to these data. b) Does this model show that
For the series of Output per hour of labor: a) Make a time series plot. b) Describe the Trend component. (Remember: Direction, Form, and Strength) c) Is there evidence of a Seasonal component?
Use the following model to forecast quarterly sales ($ Million) for a company (where time is rescaled to begin at zero and Q2, Q3, and Q4 are dummy variables for the indicated quarters), and answer the following questions. y = 1.1 + 0.2 t - 0.1 Q2 - 0.5 Q3 + 0.5 Q4 a) For the first quarter of the
Use the following model to forecast quarterly sales ($ 000) for a start-up (where time is rescaled to begin at zero and Q2, Q3, and Q4 are dummy variables for the indicated quarters), and answer the following questions. y = 15.1 + 10.5 t - 5.0 Q2 - 7.2 Q3 + 7.5 Q4 a) For the first quarter of the
Walmart grew rapidly in the years leading up to the financial crisis. Here is the monthly revenue ($ Billion) for Walmart from November 2003 to January 2007.a) What components of a time series do you see in this timeplot? Here€™s a regression model fit using dummy variables for months and
The movie Harry Potter and the Sorcerer€™s Stone opened as a great success. But every movie sees declining revenue over time. Here are the daily revenues for the movie during its first 17 days.a) Without plotting the data, what components can you see in this series? Be specific. For some
Much of the public and private industry in Hawaii depends on tourism. The following time series plot shows the number of domestic visitors to Hawaii by air from the rest of the United States per month from January 2002 through December 2006 before the financial crisis of 2008.Here is a regression
In Exercise 39 we examined domestic tourists who visit Hawaii. Now, let€™s consider international tourism. Here€™s a time series plot of international visitors for the same time period.Here€™s the linear trend model with dummy variables for months. a) Interpret the
The Port of Oakland airport reports the number of passengers passing through each month. At first glance, this is just simple growth, but by recognizing the series as a time series, we may learn more. The following plot was created in Excel 2013.The increasing spread of the data suggests that a
We have seen that gas prices can fluctuate. But during some periods they have moved consistently. Here are the data extracted for one week of each month from January 2002 to May 2007.The bend in the plot and the increasing variation suggest a multiplicative model. Here is a multiplicative model
The plot of residuals in Exercise 41 shows an outlier that wasn€™t as evident in the data. The outlier is September 2001. Clearly, this wasn€™t a typical month for air travel. Here are three models fit to this series, a single exponential smooth, a 12-point moving average, and
Quarterly e-commerce retail sales (in millions of dollars) in the United States are provided. Use this time series to answer the following questions. a) Fit a linear trend model to this series but do not use the last two quarters (Q4 2007 and Q1 2008). b) Fit an exponential trend model to this
For the series of Output per unit of capital: a) Make a time series plot. b) Describe the Trend component. c) Is there evidence of a Seasonal component? d) Is there evidence of a cyclic component?
a) Fit a linear trend model with dummy variables for the seasonal effect to the e-commerce data in Exercise 44.b) Fit an exponential trend (multiplicative) model with dummy variables to these data.c) Which model fits better?
Using the data from Exercise 42, develop and compare the following models.In exercisea) Fit an appropriate autoregressive model by testing for the significance of each autoregressive term.b) Obtain a forecast for the week of May 28, 2007.c) Compare your forecast to the actual value (by computing
A time series plot of monthly crude oil price ($/ barrel) from January 2001 to March 2007 is shown here.Using these data,a) Fit a first-order autoregressive model.b) Obtain a forecast for March 2007.
Return to the oil price data of Exercise 47. a) Find a linear model for this series. b) Find an exponential (multiplicative) model for this series. c) For the model of Exercise 47 and the models of parts a and b, compute the MAPE. Which model did best? Given the plot in Exercise 47, explain why.
Following is the time series plot for the monthly U.S. Unemployment rate (%) from January 2003 to June 2013. These data have been seasonally adjusted (meaning that the seasonal component has already been removed).a) What time series components do you observe in this series?b) Develop a 6-month and
Using the data from Exercise 49 develop and compare the following models:In exercisea) Fit a regression model with just Year as the predictor.b) Add a lag1 component to the model of (a). How does it change the coefficient of Year?c) Add lag2 and lag3 components to the model. How do the coefficients
In Exercise 39, we fit a linear regression for the number of monthly domestic visitors to Hawaii (for the years 2002 through 2006) using Time and dummy variables for the months as predictors. The R2 value was 96.6% and a residual plot against Time would show no discernible pattern. The data set for
In Exercise 40, we fit a linear regression for the number of monthly international visitors to Hawaii (for the years 2002 through 2006) using Time and dummy variables for the months as predictors. The R2 value was 59.9% and a residual plot against Time would show a few low outliers, but no
For the Apple prices:a) Find a 2-point moving average of the first year (2006).b) Use it to predict the value for January 2007.
For the Gas prices:a) Find a 2-point moving average of the first year.b) Use it to predict the value for January 2007.
For the Apple prices smoothed in Exercise 5, the actual value for January 2007 was 1.034. Find the absolute percentage error of your forecast.
For the Gas prices of Exercise 6, the actual value for January 2007 was 2.321. Find the absolute percentage error of your forecast.
For the Apple prices of Exercise 5, find the lag1 version of the prices.
Showing 14900 - 15000
of 88243
First
143
144
145
146
147
148
149
150
151
152
153
154
155
156
157
Last
Step by Step Answers
.png)
-1.png)
-2.png)
.png)
.png)
-1.png)
-2.png)
.png)
.png)
.png)
.png)
.png)
.png)
.png)
-1.png)
-2.png)
.png)
.png)
.png)
.png)
.png)
.png)
.png)
.png)
.png)
.png)
-1.png)
-2.png)
-3.png)
.png)
-1.png)
-2.png)
-3.png)
-1.png)
-2.png)
-1.png)
-2.png)
-3.png)
-1.png)
-2.png)
-1.png)
-2.png)
.png)
.png)
.png)
-1.png)
-2.png)
-3.png)
-1.png)
-2.png)
.png)
.png)
-1.png)
-2.png)
.png)
.png)
.png)
.png)
.png)
.png)
-1.png)
-2.png)
.png)
.png)
-1.png)
-2.png)
-3.png)
-1.png)
-2.png)
-1.png)
-2.png)
-1.png)
-2.png)
-1.png)
-2.png)
-1.png)
-2.png)
-1.png)
-2.png)
-3.png)
-1.png)
-2.png)
.png)
.png)
.png)
.png)
.png)
.png)
.png)
.png)
.png)
.png)

