New Semester
Started
Get
50% OFF
Study Help!
--h --m --s
Claim Now
Question Answers
Textbooks
Find textbooks, questions and answers
Oops, something went wrong!
Change your search query and then try again
S
Books
FREE
Study Help
Expert Questions
Accounting
General Management
Mathematics
Finance
Organizational Behaviour
Law
Physics
Operating System
Management Leadership
Sociology
Programming
Marketing
Database
Computer Network
Economics
Textbooks Solutions
Accounting
Managerial Accounting
Management Leadership
Cost Accounting
Statistics
Business Law
Corporate Finance
Finance
Economics
Auditing
Tutors
Online Tutors
Find a Tutor
Hire a Tutor
Become a Tutor
AI Tutor
AI Study Planner
NEW
Sell Books
Search
Search
Sign In
Register
study help
mathematics
statistics
Essentials Of Business Statistics Communicating With Numbers 1st Edition Sanjiv Jaggia, Alison Kelly - Solutions
A survey asked chief executives at leading U.S. firms the following question: €œWhere do you expect the U.S. economy to be 12 months from now?€ A representative sample of their responses appears below:a. Construct frequency and relative frequency distributions that summarize
AccuWeather.com reported the following weather delays at these major U.S. airline hubs for July 21, 2010:a. Construct frequency and relative frequency distributions that summarize the delays at major U.S. hubs. What was the most common type of delay? Explain.b. Use Excel to construct a pie chart
Fifty pro-football rookies were rated on a scale of 1 to 5, based on performance at a training camp as well as on past performance. A ranking of 1 indicated a poor prospect whereas a ranking of 5 indicated an excellent prospect. The following frequency distribution was constructed.Rating
A recent survey asked 5,324 individuals: “What’s most important to you when choosing where to live?” The responses are shown in the following relative frequency distribution.Response .....Relative FrequencyGood jobs ......0.37Affordable homes ...0.15Top schools .....0.11Low crime
What is the perfect summer trip? A National Geographic Kids survey (AAA Horizons, April 2007) asked this question to 316 children ages 8 to 14. Their responses are given in the following frequency distribution.Top Vacation Choice …………… FrequencyCruises
The following table lists U.S. revenue (in $ billions) of the major car-rental companies.Car-Rental Company ...... Revenue in 2009Enterprise ........... $10.7Hertz ............. 4.7Avis Budget .......... 4.0Dollar Thrifty ........ 1.5Other ............. 1.0a. Construct a relative
A survey conducted by CBS News asked 829 respondents which of the following events will happen first. The responses are summarized in the following table:Cure for cancer found ..... 40%End of dependence on oil ..... 27%Signs of life in outer space ... 12%Peace in Middle East ...... 8%Other
A 2010 poll conducted by NBC asked respondents who would win Super Bowl XLV in 2011. The responses by 20,825 people are summarized in the following table.Team ......... Number of VotesAtlanta Falcons .......... 4,040New Orleans Saints .. 1,880Houston Texans ..... 1,791Dallas Cowboys
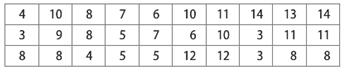
Consider the following data set:a. Construct a frequency distribution using classes of 3 up to 5, 5 up to 7, etc.b. Construct relative frequency, cumulative frequency, and cumulative relative frequency distributions.c. How many of the observations are at least 7 but less than 9? How many of the
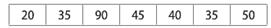
Consider the following data set:a. Construct a frequency distribution using classes of 210 up to 0, 0 up to 10, etc. How many of the observations are at least 10 but less than 20?b. Construct a relative frequency distribution and a cumulative relative frequency distribution. What percent of the
Consider the following frequency distribution:Class ...... Frequency10 up to 20 ... 1220 up to 30 .... 1530 up to 40 ... 2540 up to 50 ... 4a. Construct a relative frequency distribution. Graph a relative frequency histogram.b. Construct a cumulative frequency distribution
Consider the following frequency distribution:Class ....... Frequency1000 up to 1100 ..... 21100 up to 1200 ... 71200 up to 1300 ... 31300 up to 1400 .... 4a. Construct a relative frequency distribution. What percent of the observations are at least 1100 but less than
Consider the following cumulative frequency distribution:Class ..... Cumulative Frequency15 up to 25 .... 3025 up to 35 .... 5035 up to 45 .... 12045 up to 55 .... 130a. Construct a frequency distribution. How many observations are at least 35 but less than 45?b. Graph a frequency
Consider the following relative frequency distribution: Class ...... Relative Frequency220 up to 210 ... 0.04210 up to 0 .... 0.280 up to 10 .... 0.2610 up to 20 ..... 0.2220 up to 30 ..... 0.20a. Suppose this relative frequency distribution is based on a sample of 50 observations. Construct a
Consider the following cumulative relative frequency distribution.Class .......... Cumulative Relative Frequency150 up to 200 ...... 0.10200 up to 250 ...... 0.35250 up to 300 ...... 0.70300 up to 350 ...... 1a. Construct a relative frequency distribution. What percent of the observations
Kiplinger€™s (August 2007) lists the assets (in billions of $) for the 20 largest stock mutual funds (ranked by size) as follows:a. Construct a frequency distribution using classes of 40 up to 70, 70 up to 100, etc.b. Construct the relative frequency distribution, the cumulative
The number of text messages sent by 25 13-year-olds over the past month was as follows:a. Construct a frequency distribution using classes of 500 up to 600, 600 up to 700, etc.b. Construct the relative frequency distribution, the cumulative frequency distribution, and the cumulative relative
AccuWeather.com listed the following high temperatures (in degrees Fahrenheit) for 33 European cities on July 21, 2010.a. Construct a frequency distribution using classes of 60 up to 70, 70 up to 80, etc.b. Construct the relative frequency, the cumulative frequency, and the cumulative relative
Fifty cities provided information on vacancy rates (in percent) in local apartments in the following frequency distribution.Vacancy Rate (in percent) ....Frequency0 up to 3 ........... 53 up to 6 ...........106 up to 9 ...........209 up to 12 ...........1012 up to 15 ......... 5a. Construct
The following relative frequency distribution summarizes the ages of women who had a child in the last year.Ages ...... Relative Frequency15 up to 20 ... 0.1020 up to 25 ... 0.2525 up to 30 .... 0.2830 up to 35 .... 0.2435 up to 40 .... 0.1140 up to 45 .... 0.02a. Assume the relative frequency
The manager of a nightclub near a local university recorded the ages of the last 100 guests in the following cumulative frequency distribution.Ages ....... Cumulative Frequency18 up to 22 ..... 4522 up to 26 .... 7026 up to 30 .... 8530 up to 34 .... 9634 up to 38 .... 100a. Construct
The following ogive summarizes the median household income for the 50 states in the United States (U.S. Census, 2010).a. Approximate the percentage of states with median household income less than $50,000.b. Approximate the percentage of states with median household income more than$60,000.
The following histogram summarizes the salaries (in $1,000,000s) for the 30 highest-paid players in the National Basketball Association (NBA) for the 2012 season (www.nba.com, data retrieved March 2012).a. Is the distribution symmetric? If not, is it positively or negatively skewed?b. How many NBA
The following ogive summarizes the salary (in $1,000,000s) for the 30 highest-paid players in the National Basketball Association (NBA) for the 2012 season (www.nba.com, data retrieved March 2012).a. Approximate the percentage of salaries that were less than $18,000,000.b. Approximate the number of
The following table lists a portion of the average math SAT scores for each state for the year 2009. The entire data set, labeled Math_SAT, can be found on the text website.State .......... SATAlabama .... 552Alaska ........ 516 :
The accompanying table shows a portion of median house values for the 50 states as reported by the U.S. Census Bureau in 2010. The entire data set, labeled Census, can be found on the text website.State ..... House ValueAlabama ....$117,600Alaska ......... 229,100 :
The accompanying table shows a portion of the average price for a gallon of gas for the 50 states during April 2012. The entire data set, labeled Gas_Prices_2012, can be found on the text website.State .... Price per GallonAlabama .... $4.36Alaska ... 3.79: :Wyoming .. 3.63a. Construct a
For the first three months of 2012, the stock market put up its best first-quarter performance in over a decade (Money.cnn.com, April 9, 2012). The accompanying table shows a portion of the daily price index for the Dow Jones Industrial Average (DJIA) over this period. The entire data set, labeled
Consider the following data set:Construct a stem-and-leaf diagram. Is the distribution symmetric? Explain.
Consider the following data set:Construct a stem-and-leaf diagram. Is the distribution symmetric?Explain.
A sample of patients arriving at Overbrook Hospital€™s emergency room recorded the following body temperature readings over the weekend:Construct and interpret a stem-and-leaf diagram.
Suppose the following high temperatures were recorded for major cities in the contiguous United States for a day in July.Construct and interpret a stem-and-leafdiagram.
A police officer is concerned with excessive speeds on a portion of Interstate 90 with a posted speed limit of 65 miles per hour. Using his radar gun, he records the following speeds for 25 cars and trucks:Construct a stem-and-leaf diagram. Are the officer's concerns warranted?
Spain was the winner of the 2010 World Cup, beating the Netherlands by a score of 1€“0. The ages of the players from both teams were as follows:Construct a stem-and-leaf diagram for each country. Comment on similarities and differences between the two datasets.
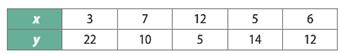
Construct a scatter plot with the following data. Categorize the relationship between x and y.
Construct a scatter plot with the following data. Does a linear relationship exist between x andy?
Construct a scatter plot with the following data. Categorize the relationship between x andy.
A statistics instructor wants to examine whether a relationship exists between the hours a student spends studying for the final exam (Hours) and a student’s grade on the final exam (Grade). She takes a sample of eight students.Construct a scatter plot. What conclusions can you draw from the
A recent study offers evidence that the more weight a woman gains during pregnancy, the higher the risk of having a high-birth-weight baby, defined as at least 8 pounds, 13 ounces, or 4 kilograms (The Wall Street Journal, August 5, 2010). High-birth-weight babies are more likely to be obese in
In order to diversify risk, investors are often encouraged to invest in assets whose returns have either a negative relationship or no relationship. The annual return data on two assets is shown below.Return A ..... Return B−20% ...... 8%−5 ........ 518 ........ 2115 ........ 22−12 .......
In an attempt to determine whether a relationship exists between the price of a home and the number of days it takes to sell the home, a real estate agent collects data on the recent sales of eight homes.Price (in $1,000s) .... Days to Sell Home265 .......... 136225 .......... 125160
A 2003 survey by the Centers for Disease Control and Prevention concluded that smoking is forbidden in nearly 75% of U.S. households (Boston Globe, May 25, 2007). The survey gathered responses from at least 900 households in each state. When residents of Utah were asked whether or not smoking was
Patrons at a local restaurant were asked to rate their recent experience at the restaurant with respect to its advertised atmosphere of upbeat, comfortable, and clean. Possible responses included Outstanding, Good, OK, and Please Get Help. The following table shows the responses of 28 patrons:a.
A survey conducted by CBS News asked parents about the professions they would want their children to pursue. The results are summarized in the following table.Profession ..............Parents’ PreferenceDoctor, banker, lawyer, or president ....65%Internet mogul ............ 13Humanitarian-aid
The one-year return (in %) for 24 mutual funds is as follows:a. Construct a frequency distribution using classes of 220 up to 210, 210 up to 0, etc.b. Construct the relative frequency, the cumulative frequency, and the cumulative relative frequency distributions.c. How many of the funds had
The Statistical Abstract of the United States, 2010 provided the following frequency distribution of the number of people who live below the poverty level by region.Region ...... Number of People (in 1,000s)Northeast ..... 6,166Midwest ..... 7,237South ...... 15,501West ...... 8,372a.
Money magazine (January 2007) reported that an average of 77 million adults in the United States make financial resolutions at the beginning of a new year. Consider the following frequency distribution, which reports the top financial resolutions of 1,026 Americans (MONEY/ICR poll conducted
A recent poll of 3,057 individuals asked: “What’s the longest vacation you plan to take this summer?” The following relative frequency distribution summarizes the results.Response ....... Relative FrequencyA few days ....... 0.21A few long weekends ... 0.18One week ....... 0.36Two weeks
A survey conducted by CBS News asked 1,026 respondents:“What would you do with an unexpected tax refund?” The responses are summarized in the following table.Pay of debts ..... 47%Put it in the bank .... 30%Spend it ....... 11%I never get a refund .... 10%Other ........ 2%a. Construct a bar
The following table lists the U.S. sales (in $ millions) of prescription drugs used to treat seizure disorders.Drug ........ Sales in 2006Topamax ...... $1,825.4Lamictal ....... 1,684.3Depakote ...... 770.4Lyrica ........ 727.8Keppra ....... 710.5a. Construct a relative frequency
The manager at a water park constructed the following frequency distribution to summarize attendance in July and August.Attendance ..... Frequency1,000 up to 1,250 .... 51,250 up to 1,500 .... 61,500 up to 1,750 .... 101,750 up to 2,000 ... 202,000 up to 2,250 .. 152,250 up to 2,500 .... 4a.
A researcher conducts a mileage economy test involving 80 cars. The frequency distribution describing average miles per gallon (mpg) appears in the following table.Average mpg ..... Frequency15 up to 20 ...... 1520 up to 25 ...... 3025 up to 30 ...... 1530 up to 35 ...... 1035 up to 40...... 740
The Wall Street Journal (August 28, 2006) asked its readers:“Ideally, how many days a week, if any, would you work from home?” The following relative frequency distribution summarizes the responses from 3,478 readers.Days Working from Home .. Relative Frequency0 ............. 0.121
The accompanying table lists a portion of the ages and net worth of the wealthiest people in America; the complete data set can be found on the text website and is labeled Wealthiest_Americans.a. What percentage of the wealthiest people in America had net worth more than $20 billion?b. What
The price-to-earnings growth ratio, or PEG ratio, is the market’s valuation of a company relative to its earnings prospects. A PEG ratio of 1 indicates that the stock’s price is in line with growth expectations. A PEG ratio less than 1 suggests that the stock of the company is undervalued
The following table lists the sale price and type of 20 recently sold houses in New Jersey.a. Construct a frequency distribution on types of houses sold in New Jersey. Interpret your findings.b. Construct a frequency distribution for house price using classes of $300,000 up to $350,000, $350,000 up
A manager of a local retail store analyzes the relationship between Advertising (in $100s) and Sales (in $1,000s) by reviewing the store’s data for the previous six months. Construct a scatter plot and comment on whether or not a relationship exists. Advertising (in $100s) ..... Sales (in
The following table lists the National Basketball Association€™s (NBA€™s) leading scorers, their average minutes per game (MPG), and their average points per game (PPG) for 2008:Construct and interpret a scatter plot of PPG against MPG. Does a relationship exist between the two
In a recent USA TODAY/Gallup Poll, respondents favored Barack Obama over Mitt Romney in terms of likeability, 60% to 30% (Los Angeles Times, July 28, 2012). The following bar chart summarizes the responses.a. What percentage of respondents favored neither Obama nor Romney in terms of likeability?b.
A recent survey of 992 people asked: In which professional sport€”football, boxing, hockey, or martial arts€”is an athlete most likely to sustain an injury that will affect the athlete after he or she retires? (Vanity Fair, January 29, 2012.)The following pie chart summarizes the
The accompanying figure plots the monthly stock price of Caterpillar, Inc., from July 2009 through March 2011. The stock has experienced tremendous growth over this time period, almost tripling in price. Does the figure reflect this growth? If not, whynot?
The following relative frequency histogram summarizes the median household income for the 50 states in the United States (U.S. Census, 2010).a. Is the distribution symmetric? If not, is it positively or negatively skewed?b. What percentage of the states had median household income between $45,000
The following histogram summarizes Apple Inc.€™s monthly stock price for the years 2007 through 2011 (finance.yahoo.com, data retrieved April 20, 2012).a. Is the distribution symmetric? If not, is it positively or negatively skewed?b. Over this five-year period, approximate the minimum
In its 2000 and 2009 Annual Reports, Nike, Inc. reported the following net revenues, in millions of dollars, in four distinct regions of the world:In a report, use the sample information to:1. Convert each region’s net revenues to its respective proportion for that year. Have the proportions
When reviewing the overall strength of a particular firm, financial analysts typically examine the net profit margin. This statistic is generally calculated as the ratio of a firm’s net profit after taxes (net income) to its revenue, expressed as a percentage. For example, a 20% net profit margin
The following table lists a portion of U.S. life expectancy (in years) for the 50 states; the entire data set, labeled Life_Expectancy, can be found on the text website.In a report, use the sample information to:1. Construct appropriate tables (frequency distribution, relative frequency
Given the following observations from a sample, calculate the mean, the median, and the mode.
Given the following observations from a sample, calculate the mean, the median, and themode.
Given the following observations from a population, calculate the mean, the median, and themode.
At a small arm in Boston, seven employees were asked to report their one-way commute time (in minutes) into the city. Their responses were.a. How long was the shortest commute? The longest commute?b. Calculate the mean, the median, and the mode.
In order to get an idea on current buying trends, a real estate agent collects data on 10 recent house sales in the area. Specifically, she notes the number of bedrooms in each house as follows:a. Calculate the mean, the median, and the mode.b. Which measure of central location best reflects the
The following table shows the 10 highest-paid chief executive officers of the last decade.a. Calculate the mean compensation for the 10 highest-paid chief executive officers.b. Does the mean accurately reflect the center of the data?Explain.
An investor bought common stock of Dell Inc. on three occasions at the following prices. Date ...... Price Per ShareJanuary 2009 ... $10.34July 2009 .... $13.98December 2009 ... $14.02a. What is the average price per share if the investor had bought 100 shares in January, 60 in July, and 40 in
The following table shows Fortune 500€™s rankings of America€™s 10 largest corporations for 2010. Next to each corporation is its market capitalization (in billions of dollars as of March 26, 2010) and its total return to investors for the year 2009. These data, labeled
One important statistic in baseball is a pitcher€™s earned run average, or ERA. This number represents the average number of earned runs given up by the pitcher per nine innings. The following table lists a portion of the ERAs for pitchers playing for the New York Yankees and the
Calculate the 20th, 50th, and 80th percentiles for the following dataset:
Calculate the 20th, 40th, and 70th percentiles for the following dataset:
Consider the following data set:a. Calculate and interpret the 25th, 50th, and 75th percentiles. b. Construct a box plot. Are there any outliers?
Consider the following data set:a. Calculate and interpret the 25th, 50th, and 75th percentiles. b. Construct a box plot. Are there anyoutliers?
Scores on the final in a statistics class are as follows.a. Calculate and interpret the 25th, 50th, and 75th percentiles.b. Construct a box plot. Are there any outliers? Is the distribution symmetric? If not, comment on its skewness.
Consider the return data (in percent) for the Income fund in Table.a. Calculate and interpret the 25th, 50th, and 75th percentiles.b. Construct a box plot. Are there any outliers?c. Is the distribution symmetric? If not, comment on its skewness.
A price-earnings ratio or P/E ratio is calculated as a firm’s share price compared to the income or profit earned by the firm per share. Generally, a high P/E ratio suggests that investors are expecting higher earnings growth in the future compared to companies with a lower P/E ratio. The
The accompanying table shows a portion of median household income (Income) and median house value (House Value) for the 50 states in 2010. The entire data set, labeled Census, can be found on the text website.a. Construct a box plot for household income and use it to identify outliers, if any, and
Consider the following population data:a. Calculate the range.b. Calculate MAD.c. Calculate the population variance.d. Calculate the population standarddeviation.
Consider the following population data:a. Calculate the range.b. Calculate MAD.c. Calculate the population variance.d. Calculate the population standarddeviation.
Consider the following sample data:a. Calculate the range.b. Calculate MAD.c. Calculate the sample variance.d. Calculate the sample standarddeviation.
Consider the following sample data:a. Calculate the range.b. Calculate MAD.c. Calculate the sample variance and the sample standard deviation.
The Department of Transportation (DOT) fields thousands of complaints about airlines each year. The DOT categorizes and tallies complaints, and then periodically publishes rankings of airline performance. The following table presents the 2006 results for the 10 largest U.S. airlines.a. Which
The monthly closing stock prices (rounded to the nearest dollar) for Starbucks Corp. and Panera Bread Co. for the first six months of 2010 are reported in the following table.a. Calculate the sample variance and the sample standard deviation for each firm’s stock price.b. Which firm’s
While the housing market is in recession and is not likely to emerge anytime soon, real estate investment in college towns continues to promise good returns (The Wall Street Journal, September 24, 2010). Marcela Treisman works for an investment firm in Michigan. Her assignment is to analyze the
Go to the text website and access the data labeled Largest_Corporations. It shows the Fortune 500 rankings of America’s largest corporations for 2010. Next to each corporation are its market capitalization (in billions of dollars as of March 26, 2010) and its total return to investors for the
Go to the text website and access the data labeled Census. It shows, among other variables, median household income and median house value for the 50 states.a. Compute and discuss the range of household income and house value.b. Compute the sample MAD and the sample standard deviation of
Consider the following data for two investments, A and B:a. Which investment provides the higher return? Which investment provides less risk? Explain.b. Given a risk-free rate of 2%, calculate the Sharpe ratio for each investment. Which investment provides the higher reward per unit of risk?Explain.
Consider the following data for two investments, A and B:a. Which investment provides the higher return? Which investment provides less risk? Explain.b. Given a risk-free rate of 1.4%, calculate the Sharpe ratio for each investment. Which investment provides the higher reward per unit of
Consider the following returns for two investments, A and B, over the past four years:a. Which investment provides the higher return?b. Which investment provides less risk?c. Given a risk-free rate of 1.2%, calculate the Sharpe ratio for each investment. Which investment has performed
The following table shows the annual returns (in percent) and summary measures for the Vanguard Energy Fund and the Vanguard Health Care Fund from 2005 through 2009.a. Which fund had the higher average return?b. Which fund was riskier over this time period?c. Given a risk-free rate of 3%, which
The following table shows the annual returns (in percent) for the Fidelity Latin America Fund and the Fidelity Canada Fund from 2005 through 2009.a. Which fund had the higher average return?b. Which fund was riskier over this time period?c. Given a risk-free rate of 3%, which fund has the higher
The accompanying table shows a portion of the annual return (in percent) for the Fidelity Select Technology Fund and Fidelity Select Energy Fund from 2000 through 2011. The entire data set, labeled Fidelity_Select, can be found on the text website.a. Compare the sample mean and the sample standard
A data set has a mean of 80 and a standard deviation of 5.a. Using Chebyshev’s theorem, what percentage of the observations fall between 70 and 90?b. Using Chebyshev’s theorem, what percentage of the observations fall between 65 and 95?
A data set has a mean of 1500 and a standard deviation of 100.a. Using Chebyshev’s theorem, what percentage of the observations fall between 1300 and 1700?b. Using Chebyshev’s theorem, what percentage of the observations fall between 1100 and 1900?
Showing 6300 - 6400
of 88243
First
57
58
59
60
61
62
63
64
65
66
67
68
69
70
71
Last
Step by Step Answers
.png)
.png)
.png)
.png)
.png)
.png)
.png)
.png)
.png)
.png)
.png)
.png)
.png)
.png)
.png)
.png)
.png)
.png)
-1.png)
-2.png)
.png)
.png)
.png)
.png)
.png)
.png)
.png)
.png)
.png)
.png)
.png)
.png)
.png)
.png)
.png)
.png)
.png)
.png)
.png)
.png)
.png)
.png)
.png)
.png)
.png)
.png)
.png)
.png)
.png)
.png)
.png)
.png)
.png)
.png)

