

Method of continuous variation. Make a graph of absorbance versus mole fraction of thiocyanate from the data
Question:
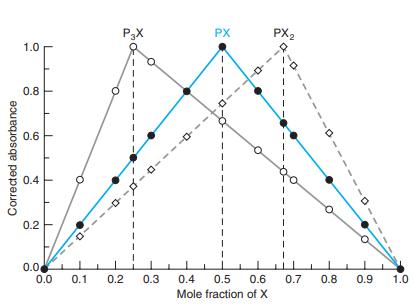
Method of continuous variation. Make a graph of absorbance versus mole fraction of thiocyanate from the data in the table.
.png)
(a) What is the stoichiometry of the predominant Fe(SCN)n3-n species?
(b) Why is the peak not as sharp as those in Figure 18-8?
(c) Why does one solution contain 10.0 mM acid and the other 15.0 mM acid?
Figure 18-8
Fantastic news! We've Found the answer you've been seeking!
Step by Step Answer:
a Maximum absorbance occurs at XSCN 0500 stoichiometry 1 1 ...View the full answer

Answered By
Cyrus Sandoval
I a web and systems developer with a vast array of knowledge in many different front end and back end languages, responsive frameworks, databases, and best code practices. My objective is simply to be the best web developer that i can be and to contribute to the technology industry all that i know and i can do. My skills include:
- Front end languages: css, HTML, Javascript, XML
- Frameworks: Angular, Jquery, Bootstrap, Jasmine, Mocha
- Back End Languages: Java, Javascript, PHP,kotlin
- Databases: MySQL, PostegreSQL, Mongo, Cassandra
- Tools: Atom, Aptana, Eclipse, Android Studio, Notepad++, Netbeans.
Having a degree in Computer Science enabled me to deeply learn most of the things regarding programming, and i believe that my understanding of problem solving and complex algorithms are also skills that have and will continue to contribute to my overall success as a developer.
I’ve worked on countless freelance projects and have been involved with a handful of notable startups. Also while freelancing I was involved in doing other IT tasks requiring the use of computers from working with data, content creation and transcription.
1+ Reviews
10+ Question Solved
Related Book For 

Question Posted:
