

Question: The indicator xylenol orange (Table 11-3) forms a complex with Zr(IV) in HCl solution. Prepare a Job plot from the data in the table and
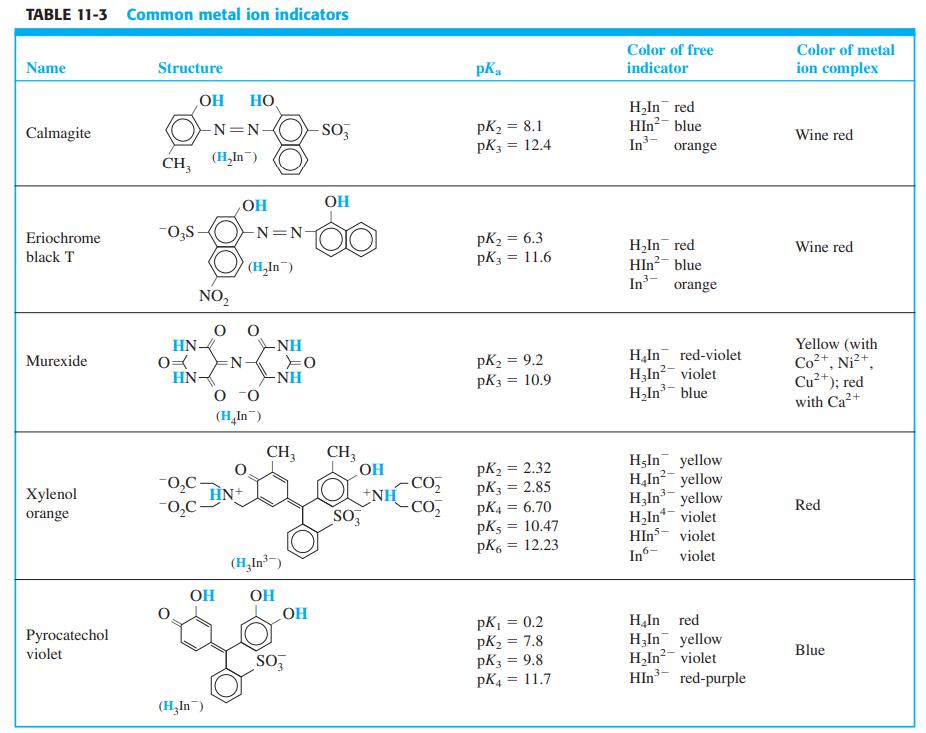
The indicator xylenol orange (Table 11-3) forms a complex with Zr(IV) in HCl solution. Prepare a Job plot from the data in the table and suggest the stoichiometry of the complex (xylenol orange)xZrz.
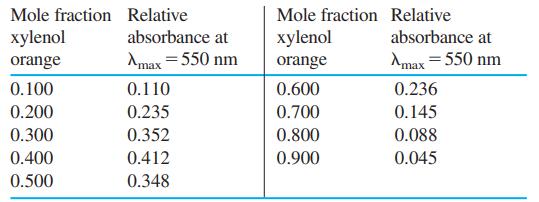
Table 11-3
Mole fraction Relative Mole fraction Relative xylenol absorbance at xylenol absorbance at orange Amax = 550 nm orange Amax = 550 nm 0.100 0.110 0.600 0.236 0.200 0.235 0.700 0.145 0.300 0.352 0.800 0.088 0.400 0.412 0.900 0.045 0.500 0.348
Step by Step Solution
3.33 Rating (171 Votes )
There are 3 Steps involved in it
The Job plot peak is at a xylenol orange mole fraction of 040 ... View full answer

Get step-by-step solutions from verified subject matter experts
Document Format (1 attachment)
878-E-C-E-E-C (2169).docx
120 KBs Word File