

Question: A. Develop a spreadsheet to calculate the ratios for the financial and internal perspectives of the balanced scorecard for 2009 and 2008. B. Comment on
A. Develop a spreadsheet to calculate the ratios for the financial and internal perspectives of the balanced scorecard for 2009 and 2008.
B. Comment on any trend you see from your ratio analysis.
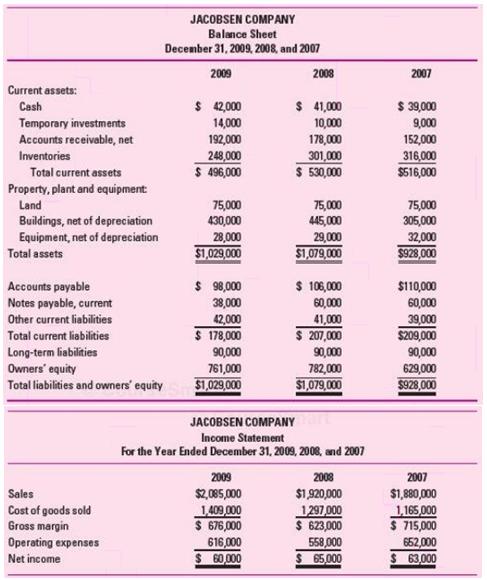
JACOBSEN COMPANY Balance Sheet December 31, 2009, 2008, and 2007 2008 Current assets: S 42,000 14,000 192,000 248,000 S 496,000 $ 41,000 10,000 178,000 301,000 S 530,000 $ 39,000 9,000 152,000 316,000 $516,000 Cash Temporary investments Accounts receivable, net Total current assets Property, plant and equipment 75,000 445,000 75,000 75,000 305,000 32,000 $928,000 Buildings, net of depreciation Equipment, net of depreciation 28,000 1,029,000 Total assets 1,079,000 Accounts payable Notes payable, current Other current liabilities Total current liabilities Long-term liabilities Owners equity S 98,000 S 106,000 $110,000 42,000 178,000 90,000 761,000 Total liabilities and owners' equity 1,029,000 41,000 S 207,000 90,000 782,000 079,000 39,000 $209,000 90,000 JACOBSEN COMPANY Income Statement For the Year Ended December 31, 2009, 2008, and 2007 2009 $2,085,000 1,409,000 $ 676,000 616,000 $ 60000 2007 $1,880,000 1,165 000 $ 715,000 652,000 63,000 2008 Sales Cost of goods sold Gross margin Operating expenses Net income $1,920,000 S 623,000 $ 65000 558,000
Step by Step Solution
3.45 Rating (161 Votes )
There are 3 Steps involved in it
Data 2014 2013 2012 Cash 42000 41000 39000 Temporary investments 14000 10000 9000 Accounts receivabl... View full answer

Get step-by-step solutions from verified subject matter experts
Document Format (1 attachment)
423-B-M-L-O-M (3597).docx
120 KBs Word File