

Question: Look at the attached scatterplot below that compares Per Capita Meat Consumption and Colon Cancer incidence per country. Now that you are equipped with the
Look at the attached scatterplot below that compares Per Capita Meat Consumption and Colon Cancer incidence per country. Now that you are equipped with the concept of correlation, do you think that we can make a statistically significant inference about the relationship between meat consumption and colon cancer?
Consider the following points in answering this question:
- Do we need to survey more countries to make a conclusion?
- How strong is the correlation? What do you think the r^2 would be if you ran a linear regression?
- Are there any other factors we should take into consideration besides meat consumption?
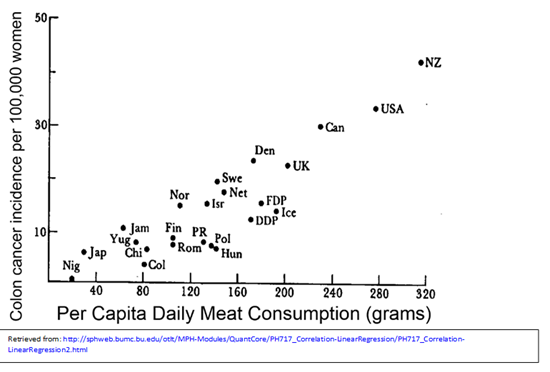
50 .NZ . USA 30 . Can Den . UK Colon cancer incidence per 100,000 women .Swe Nor . Net .Isr . FDP .Ice . DDP 10 Yug. . Jam Fin PR pol . Jap Chi Rom Hun Nig . Col 40 80 120 160 200 240 280 320 Per Capita Daily Meat Consumption (grams) Retrieved from: hap://'sphweb bume. bu.edw/othe/MPH-Modules/QuantCore/PH717_Correlation-LinearRegression/PH717_Correlation- LinearRegression? heml
Step by Step Solution
There are 3 Steps involved in it

Get step-by-step solutions from verified subject matter experts