

Carry out the diagnostic tests for the olson_crd fitted model in Example 13.3.4. Repeat a similar exercise
Question:
Carry out the diagnostic tests for the olson_crd fitted model in Example 13.3.4. Repeat a similar exercise for the ANOVA model fitted in Example 13.3.2.
Data from in Example 13.3.4
We need to determine the effect of the number of revolutions per minute (rpm) of the rotary pump head of an Olson heart–lung pump on the fluid flow rate Liters_minute. The rpm’s are replicated at 50, 75, 100, 125, and 150 levels with respective frequencies 5, 3, 5, 2, and 5. The fluid flow rate is measured in liters per minute.

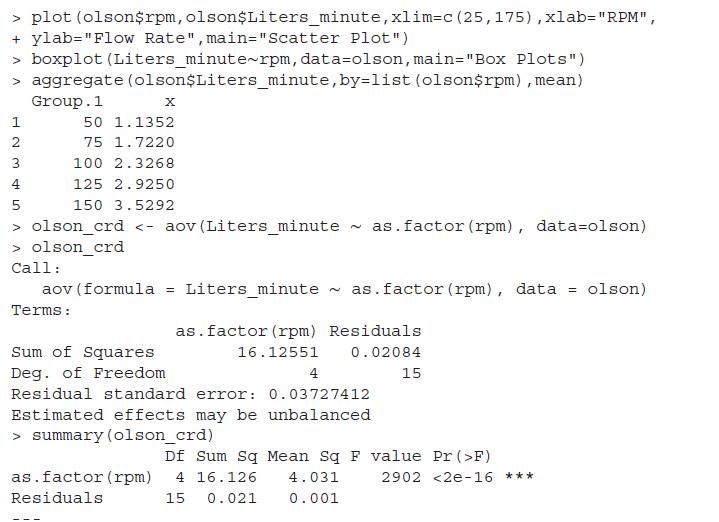
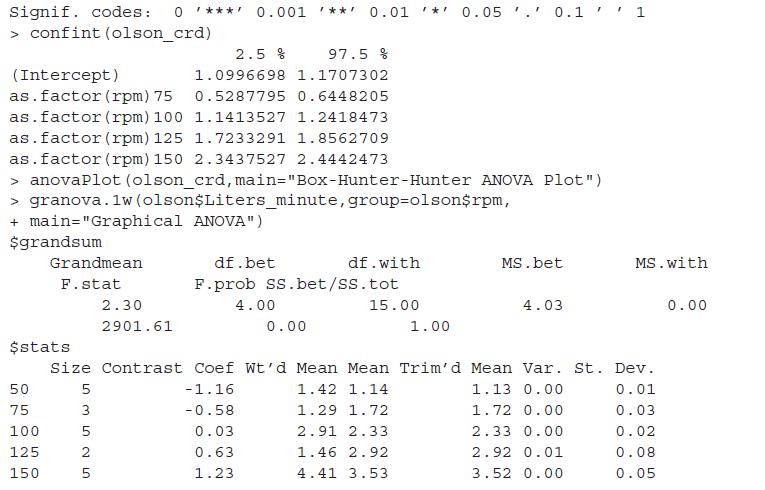
The scatter plot clearly indicates, Figure 13.2, that as the RPM is increasing, there is an increase in the flow rate too. This is further confirmed by the box plot which shows that the average, actually median, levels are different, and since there is no overlap of the quantiles, the difference is also significant. The ANOVA tablemay be visualized as displayed by the output of granova.1w, and the Box-Hunter-Hunter ANOVA plot is left to the reader for interpretation. Since the p-value, in Pr(>F), is significantly zero, we reject the hypothesis that the treatment effects are equal. The 95% confidence intervals for the four treatments do not contain 0 and hence we can conclude that each of the treatments has a non-zero rpm because of it.
Step by Step Answer:
Solution The diagnostic tests for the olsoncrd fitted model in Example 1334 is as follows i BoxPlot ...View the full answer


A Course In Statistics With R
ISBN: 9781119152729
1st Edition
Authors: Prabhanjan N. Tattar, Suresh Ramaiah, B. G. Manjunath
