

Consider the following ordinary differential equation model for the spread of a communicable disease: where N is
Question:
Consider the following ordinary differential equation model for the spread of a communicable disease:
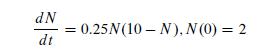
where N is measured in 100's. Analyze the behavior of this differential equation as follows.
a. Since this is an autonomous differential equation, perform a qualitative graphical analysis as discussed in Section 11.4.
(i) Plot dN/dt versus N: Find and label all rest points (equilibrium points).
(ii) Estimate the value where the rate of change of the disease is the fastest. Justify your answer.
(iii) Plot N versus t for each of the following initial conditions:
![]()
(iv) Describe the stability of each rest point (equilibrium point).
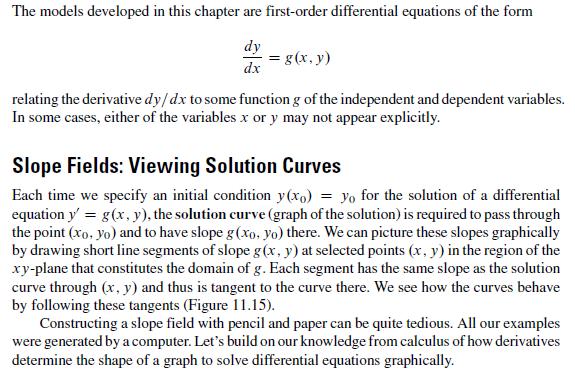
b. Obtain a slope field plot of this differential equation. Briefly analyze the slope field
plot. Compare it to your qualitative plot in part (a) above.
c. Solve this differential equation using the separation of variables technique. Plot the solution over the interval of time from [0, 10]. How does your actual solution compare to the qualitative graphical solution?
d. Compute the time t when N is changing the fastest using the initial condition N (0) = 2. Compare your answer to your qualitative estimate in part a(iii) above.
e. Use Euler's Method with step sizes of h = 1 and then h = 0.1 to approximate the solution to the differential equation for N (0.5) and N (5). Find the relative error at these values. Obtain graphical plots of the numerical solution. How do they compare to the plots of the actual solution?
f. Repeat part (e) using either the Improved Euler's Method or the Runge-Kutta Method.
Data from section 11.4
Step by Step Answer:

This question has not been answered yet.
You can Ask your question!


A First Course In Mathematical Modeling
ISBN: 9781285050904
5th Edition
Authors: Frank R. Giordano, William P. Fox, Steven B. Horton
