

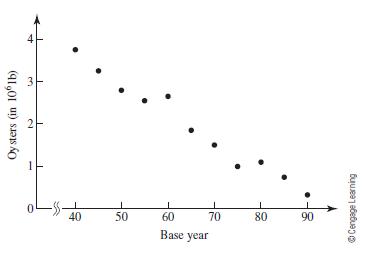
Table 4.7 and Figure 4.9 present data representing the commercial harvesting of oysters in Chesapeake Bay. Fit
Question:
Table 4.7 and Figure 4.9 present data representing the commercial harvesting of oysters in Chesapeake Bay. Fit a simple, one-term model to the data. How well does the best one-term model you find fit the data? What is the largest error? The average error?
Table 4.7
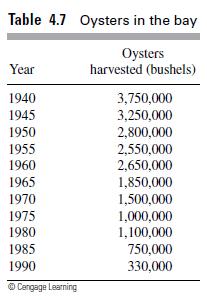
Figure 4.9
Fantastic news! We've Found the answer you've been seeking!
Step by Step Answer:

Answered By
Utsab mitra
I have the expertise to deliver these subjects to college and higher-level students. The services would involve only solving assignments, homework help, and others.
I have experience in delivering these subjects for the last 6 years on a freelancing basis in different companies around the globe. I am CMA certified and CGMA UK. I have professional experience of 18 years in the industry involved in the manufacturing company and IT implementation experience of over 12 years.
I have delivered this help to students effortlessly, which is essential to give the students a good grade in their studies.
2+ Reviews
10+ Question Solved
Related Book For 

A First Course In Mathematical Modeling
ISBN: 9781285050904
5th Edition
Authors: Frank R. Giordano, William P. Fox, Steven B. Horton
Question Posted:
