

The following data represent the population of the United States from 1790 to 2000. In Problems 6-12,
Question:
The following data represent the population of the United States from 1790 to 2000.
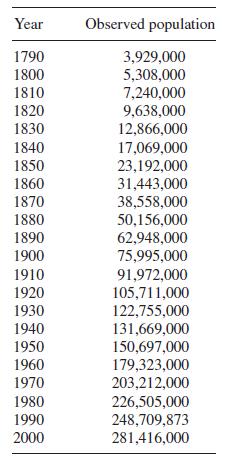
In Problems 6-12, construct a scatterplot of the given data. Is there a trend in the data?
Are any of the data points outliers? Construct a divided difference table. Is smoothing with a low-order polynomial appropriate? If so, choose an appropriate polynomial and fit using the least-squares criterion of best fit. Analyze the goodness of fit by examining appropriate indicators and graphing the model, the data points, and the deviations.
Fantastic news! We've Found the answer you've been seeking!
Step by Step Answer:
import matplotlibpyplot as plt import numpy as np Data years nparange1790 2001 10 population 3929000 5308000 7240000 9638000 12866000 17069000 2319200...View the full answer

Answered By
PALASH JHANWAR
I am a Chartered Accountant with AIR 45 in CA - IPCC. I am a Merit Holder ( B.Com ). The following is my educational details.
PLEASE ACCESS MY RESUME FROM THE FOLLOWING LINK: https://drive.google.com/file/d/1hYR1uch-ff6MRC_cDB07K6VqY9kQ3SFL/view?usp=sharing
3+ Reviews
10+ Question Solved
Related Book For 

A First Course In Mathematical Modeling
ISBN: 9781285050904
5th Edition
Authors: Frank R. Giordano, William P. Fox, Steven B. Horton
Question Posted:
