

The following chart shows the number of police officers patrolling a section of a city and the
Question:
The following chart shows the number of police officers patrolling a section of a city and the number of crimes reported for 8 successive days.
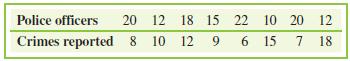
a) Determine the correlation coefficient between the number of police officers and the number of crimes reported.
b) Determine whether a correlation exists at a = 0.05.
c) Determine the equation of the line of best fit for the number of police officers and the number of crimes reported.
d) Use the equation in part (c) to estimate the average number of crimes reported when 14 police officers are patrolling that section of the city.
Round both m and b the nearest hundredth.
Fantastic news! We've Found the answer you've been seeking!
Step by Step Answer:
a b Yes 0782 0707 c d y 07214 2226 122 crimes 7 812...View the full answer

Answered By
Nikhil Singh
Work is my passion
0 Reviews
10+ Question Solved
Related Book For 

A Survey Of Mathematics With Applications
ISBN: 9780135740460
11th Edition
Authors: Allen R. Angel, Christine D. Abbott, Dennis Runde
Question Posted:
