

Question: Repeat Problem 2 using the data below for Kroger Co (NYSE: KR). However, this time you should create a copy of your worksheet to use
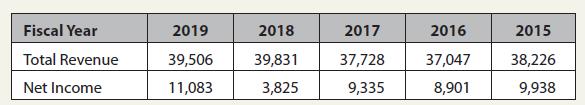
Repeat Problem 2 using the data below for Kroger Co (NYSE: KR). However, this time you should create a copy of your worksheet to use as a template. Replace the data for Oracle with that of Kroger.
a. Which company’s sales were growing faster over this period? Which one had the faster net income growth?
b. Which company was more profitable in 2019? Which was more profitable if you take a longer view? Would the volatility of the net profit margin affect your desire to invest in one company or the other?
Data from Problem 2.
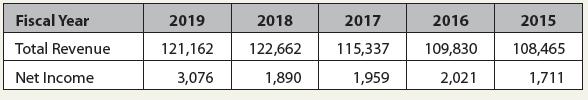
In your position as research assistant to a portfolio manager, you need to analyze the profitability of the companies in the portfolio. Using the data for Oracle Corporation (NASDAQ: ORCL) below:
Fiscal Year Total Revenue Net Income 2019 121,162 3,076 2018 122,662 1,890 2017 2016 115,337 109,830 1,959 2,021 2015 108,465 1,711
Step by Step Solution
3.50 Rating (173 Votes )
There are 3 Steps involved in it
To analyze the data well compare the growth rates and profitability for Oracle and Kroger a Growth Analysis 1 Sales Growth Oracle ORCL Sales Growth 20... View full answer

Get step-by-step solutions from verified subject matter experts