

Question: Using the data for Johnson & Johnson (NYSE: JNJ), presented below: a. Calculate the ratio of each years data to the previous year for each
Using the data for Johnson & Johnson (NYSE: JNJ), presented below:
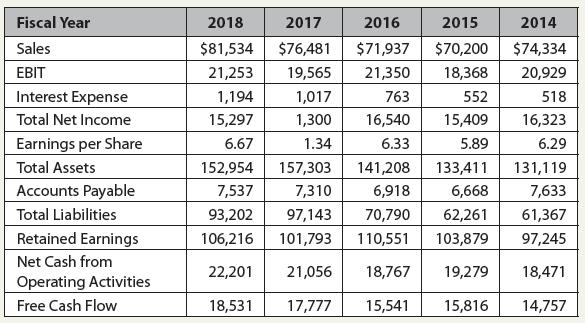
a. Calculate the ratio of each years’ data to the previous year for each of the above items for JNJ. For example, for the year 2018, the ratio for sales is $81,534/$76,481 5 1.06607.
b. From your calculations in part a, calculate each year’s rate of growth. Using the example in part a, the ratio is 1.06607, so the percentage growth in sales for 2018 is 1.06607 2 1 or 6.607%.
c. Calculate the average growth rate (using the Average function) of each of the above items using the results you calculated in part b. These averages are arithmetic averages.
d. Use the Geomean function to estimate the compound annual average growth rate (CAGR) for each of the above items using the results that you calculated in part a. Be sure to subtract 1 from the result to arrive at a percent change. These are geometric averages.
e. Compare the results from part c to those for part d for each item. Is it true that the arithmetic average growth rate is always greater than or equal to the geometric average (CAGR)?
f. Contrast the results for the geometric averages to those for the arithmetic average for the variables listed below. What do you observe about the differences in the two growth estimates for Sales and Retained Earnings? What do you observe about the differences in the two estimates for Net Cash from Operations and Net Income? Look at the results from part b (the individual yearly growth rates) for each variable to draw some conclusions about the variation between the arithmetic and geometric averages.1. Sales2. Retained Earnings3. Total Assets4. Net Cash from Operations5. Net Income
Fiscal Year Sales EBIT Interest Expense Total Net Income Earnings per Share Total Assets Accounts Payable Total Liabilities Retained Earnings Net Cash from Operating Activities Free Cash Flow 2018 2017 2016 $81,534 $76,481 $71,937 21,253 19,565 21,350 1,194 1,017 763 15,297 1,300 16,540 6.67 1.34 6.33 2015 $70,200 18,368 552 15,409 5.89 2014 $74,334 20,929 518 16,323 6.29 152,954 157,303 141,208 133,411 131,119 7,537 7,310 6,918 6,668 7,633 93,202 97,143 70,790 62,261 61,367 106,216 101,793 110,551 103,879 97,245 22,201 21,056 18,767 19,279 18,471 18,531 17,777 15,541 15,816 14,757
Step by Step Solution
3.42 Rating (152 Votes )
There are 3 Steps involved in it
To calculate the ratios growth rates and average growth rates well use the provided data for Johnson Johnson JNJ as follows Fiscal Year Sales EBIT Interest Expense Total Net Income Earnings per Share ... View full answer

Get step-by-step solutions from verified subject matter experts