

Question: Using the data in the student spreadsheet file Ethan Allen Financials.xlsx (to find the student spreadsheets for Financial Analysis with Microsoft Excel, ninth edition, go
Using the data in the student spreadsheet file Ethan Allen Financials.xlsx (to find the student spreadsheets for Financial Analysis with Microsoft Excel, ninth edition, go to (www.cengage.com/finance/mayes/analysis/9e), forecast the June 30, 2019 income statement and balance sheet for Ethan Allen. Use the percent of sales method and the following assumptions: 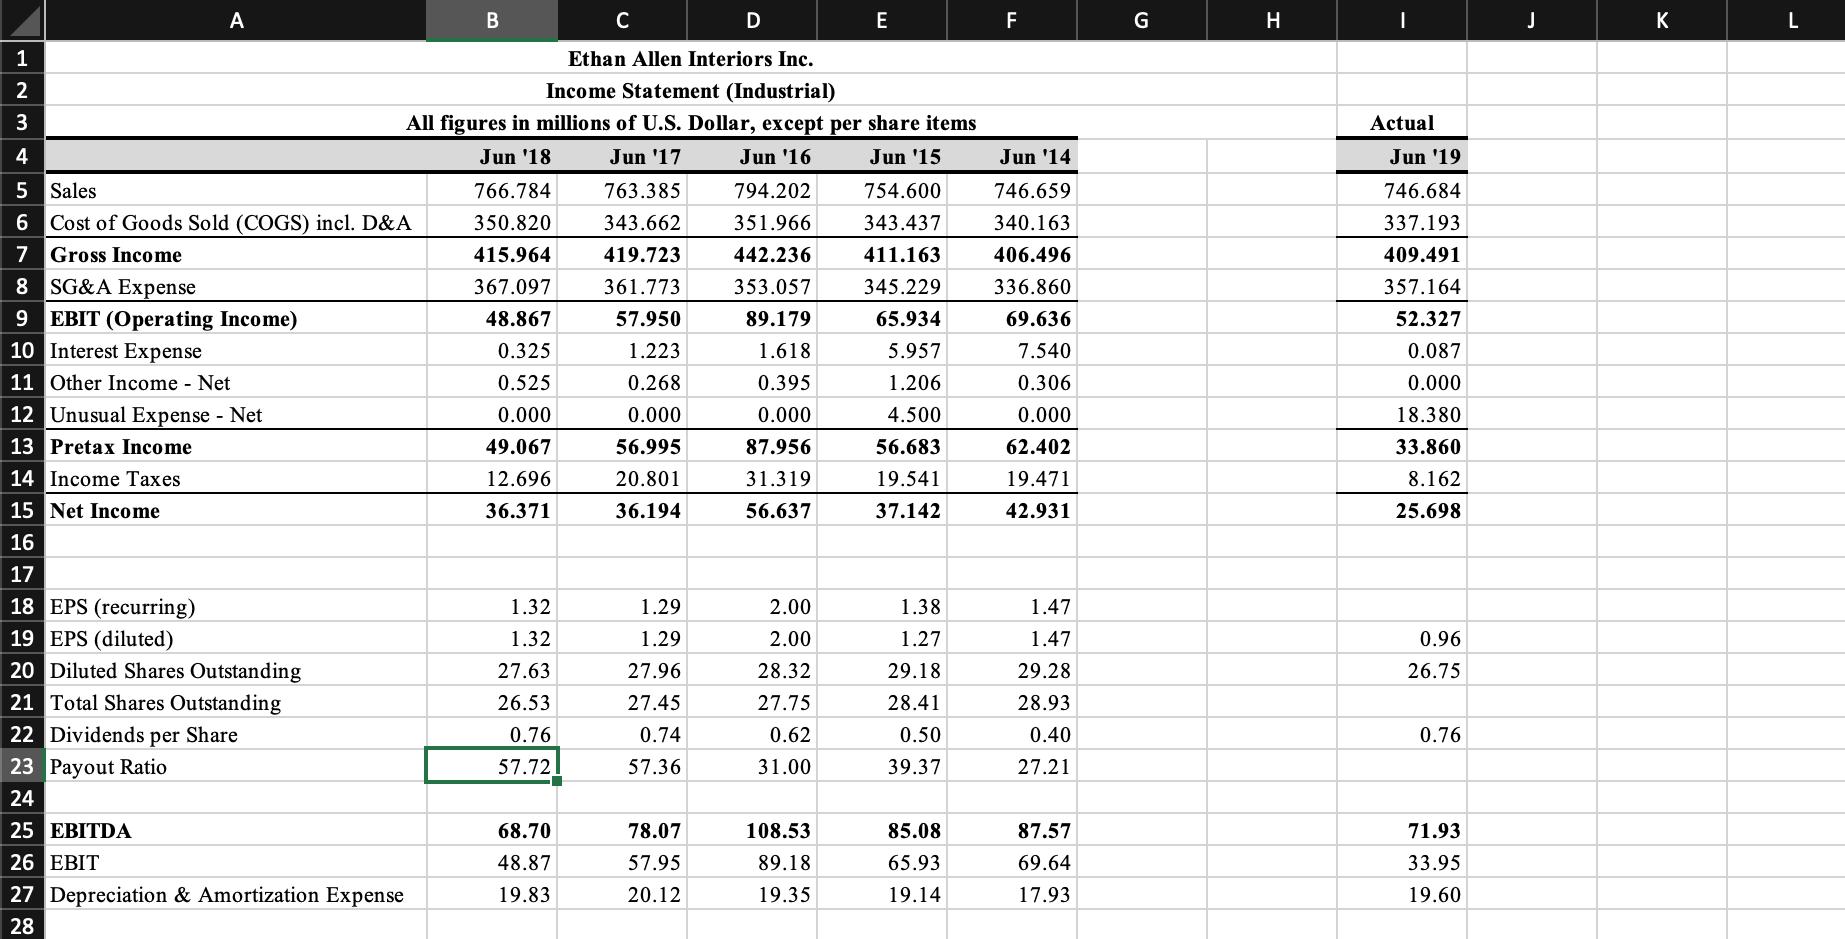
(1) Sales in FY 2019 will be $761.20;
(2) The tax rate will be 25%;
(3) Each item that changes with sales will be the five-year average percentage of sales;
(4) Property, Plant & Equipment - Gross will increase to $650;
(5) The dividend will be $0.90 per share. Use your judgment on all other items.
a. What is the DFN in 2019? Is this a surplus or deficit?b. Assume that the DFN will be absorbed by long-term debt and that the interest rate is 4% of LTD. Set up an iterative worksheet to eliminate it.
c. Create a chart of cash vs. sales and add a trend line. Is cash a consistent percentage of sales? Does this fit your expectations?
d. Use the regression tool to verify your results from part c. Is the trend statistically significant? Use at least three methods from the regression output to show why or why not.
e. Turn off iteration, and use the Scenario Manager to set up three scenarios:
1) Best Case—Sales are 5% higher than expected.
2) Base Case—Sales are exactly as expected.
3) Worst Case—Sales are 5% less than expected.
What is the DFN under each scenario?
123 A 4 5 Sales 6 Cost of Goods Sold (COGS) incl. D&A Gross Income SG&A Expense EBIT (Operating Income) 7 8 9 10 Interest Expense 11 Other Income - Net 12 Unusual Expense - Net 13 Pretax Income 14 Income Taxes 15 Net Income 16 17 18 EPS (recurring) 19 EPS (diluted) 20 Diluted Shares Outstanding 21 Total Shares Outstanding B 22 Dividends per Share 23 Payout Ratio 24 25 EBITDA 26 EBIT 27 Depreciation & Amortization Expense 28 Ethan Allen Interiors Inc. Income Statement (Industrial) All figures in millions of U.S. Dollar, except per share items Jun '18 Jun '17 763.385 Jun '16 794.202 351.966 Jun '15 754.600 343.662 343.437 419.723 442.236 411.163 361.773 353.057 345.229 57.950 89.179 65.934 1.223 1.618 5.957 0.268 0.395 1.206 0.000 0.000 4.500 56.995 87.956 56.683 20.801 31.319 19.541 36.194 56.637 37.142 766.784 350.820 415.964 367.097 48.867 0.325 0.525 0.000 49.067 12.696 36.371 1.32 1.32 27.63 26.53 0.76 57.72 C 68.70 48.87 19.83 1.29 1.29 27.96 27.45 0.74 57.36 D 78.07 57.95 20.12 2.00 2.00 28.32 27.75 0.62 31.00 E 108.53 89.18 19.35 1.38 1.27 29.18 28.41 0.50 39.37 85.08 65.93 19.14 F Jun '14 746.659 340.163 406.496 336.860 69.636 7.540 0.306 0.000 62.402 19.471 42.931 1.47 1.47 29.28 28.93 0.40 27.21 87.57 69.64 17.93 G H Actual Jun '19 746.684 337.193 409.491 357.164 52.327 0.087 0.000 18.380 33.860 8.162 25.698 0.96 26.75 0.76 71.93 33.95 19.60 J K L
Step by Step Solution
3.42 Rating (158 Votes )
There are 3 Steps involved in it
To answer your question Ill guide you through the steps you would typically take to forecast the June 30 2019 income statement and balance sheet for Ethan Allen using the percent of sales method with ... View full answer

Get step-by-step solutions from verified subject matter experts