

Question: 1. Using the data in the student spreadsheet file Ethan Allen Financials.xlsx (to find the student spreadsheets for Financial Analysis With Microsoft Excel, ninth edition,
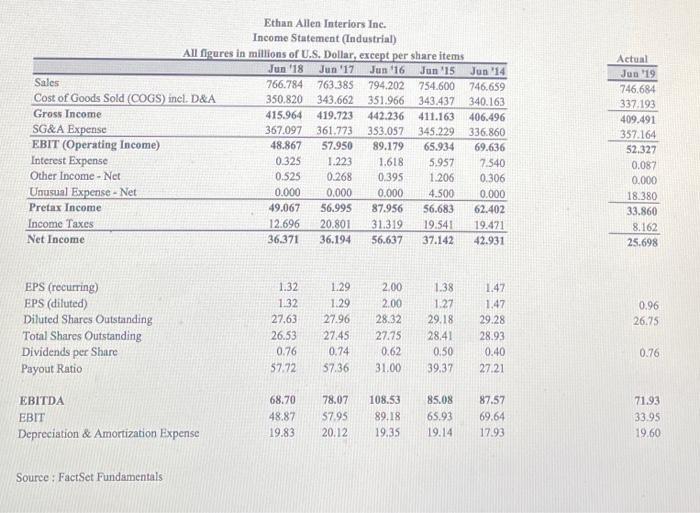
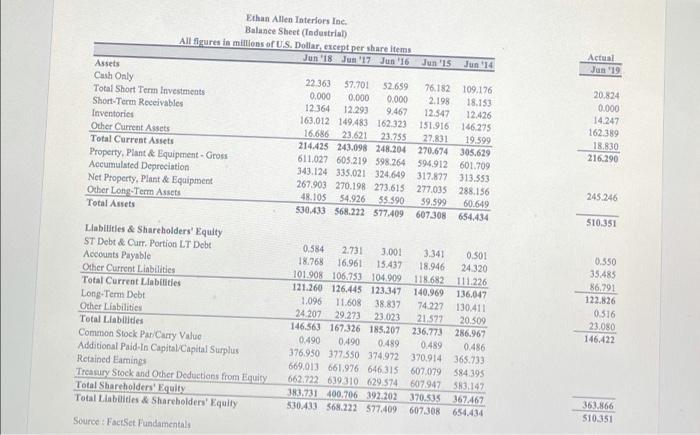
1. Using the data in the student spreadsheet file Ethan Allen Financials.xlsx (to find the student spreadsheets for Financial Analysis With Microsoft Excel, ninth edition, go to (uww.cengage.com/linance/mayes/analysis/9e), forecast the June 30, 2019 income statement and balance sheet for Ethan Allen. Use the percent of sales method and the following assumptions: (1) Sales in FY 2019 will be $761:20; (2) The tax rate will be 25\%; (3) Each item that changes with sales will be the five-year average percentage of sales; (4) Property, Plant \& Equipment - Gross will increase to $675; and (5) The dividend will be $0.90 per share. Use your judgment on all other items. a. What is the in 2019 ? Is this a surplus or deficit? b. Assume that the will be absorbed by long-term debt and that the interest rate is 4% of LTD, Set up an iterative worksheet to eliminate it. c. Create a chart of cash vs. sales and add a trend line. Is cash a consistent percentage of salos? Does this fit your expectations? d. Use the regression tool to verify your results from part c. Is the trend statistically significant? Use at least three methods from the regression output to show why or why not. 0. Tum off iteration, and use the Scenario Manager to set up three scenarios: 1) Best Case-Sales are 5% higher than expected. 2) Base Case - Sales are exactly as expected. 3) Worst Case-Sales are 5% less than expected. What is the under each scenario? Ethan Allen Interiors Inc. Income Statement (Industrial) All figures in millions of U.S. Dollar, except per share items \begin{tabular}{lrr|r|r|r|} \hline & Jun '18 & Jun '17 & Jun '16 & Jun '15 & Jun '14 \\ \hline Sales & 766.784 & 763.385 & 794.202 & 754.600 & 746.659 \\ Cost of Goods Sold (COGS) inel.D\&A & 350.820 & 343.662 & 351.966 & 343.437 & 340.163 \\ \hline Gross Income & 415.964 & 419.723 & 442.236 & 411.163 & 406.496 \\ SG\&A Expense & 367.097 & 361.773 & 353.057 & 345.229 & 336.860 \\ \hline EBIT (Operating Income) & 48.867 & 57.950 & 89.179 & 65.934 & 69.636 \\ Interest Expense & 0.325 & 1.223 & 1.618 & 5.957 & 7.540 \\ Other Income-Net & 0.525 & 0.268 & 0.395 & 1.206 & 0.306 \\ Unusual Expense - Net & 0.000 & 0.000 & 0.000 & 4.500 & 0.000 \\ \hline Pretax Income & 49.067 & 56.995 & 87.956 & 56.683 & 62.402 \\ Income Taxes & 12.696 & 20.801 & 31.319 & 19.541 & 19.471 \\ \hline Net Income & 36.371 & 36.194 & 56.637 & 37.142 & 42.931 \\ \hline \end{tabular} Souree ; FactSet Fundamentals Ehan Allen Interiors lac, Balance Sbeet (Induntrial) All fequres in millions of U.S. Dollar, exeept per share items. 1. Using the data in the student spreadsheet file Ethan Allen Financials.xlsx (to find the student spreadsheets for Financial Analysis With Microsoft Excel, ninth edition, go to (uww.cengage.com/linance/mayes/analysis/9e), forecast the June 30, 2019 income statement and balance sheet for Ethan Allen. Use the percent of sales method and the following assumptions: (1) Sales in FY 2019 will be $761:20; (2) The tax rate will be 25\%; (3) Each item that changes with sales will be the five-year average percentage of sales; (4) Property, Plant \& Equipment - Gross will increase to $675; and (5) The dividend will be $0.90 per share. Use your judgment on all other items. a. What is the in 2019 ? Is this a surplus or deficit? b. Assume that the will be absorbed by long-term debt and that the interest rate is 4% of LTD, Set up an iterative worksheet to eliminate it. c. Create a chart of cash vs. sales and add a trend line. Is cash a consistent percentage of salos? Does this fit your expectations? d. Use the regression tool to verify your results from part c. Is the trend statistically significant? Use at least three methods from the regression output to show why or why not. 0. Tum off iteration, and use the Scenario Manager to set up three scenarios: 1) Best Case-Sales are 5% higher than expected. 2) Base Case - Sales are exactly as expected. 3) Worst Case-Sales are 5% less than expected. What is the under each scenario? Ethan Allen Interiors Inc. Income Statement (Industrial) All figures in millions of U.S. Dollar, except per share items \begin{tabular}{lrr|r|r|r|} \hline & Jun '18 & Jun '17 & Jun '16 & Jun '15 & Jun '14 \\ \hline Sales & 766.784 & 763.385 & 794.202 & 754.600 & 746.659 \\ Cost of Goods Sold (COGS) inel.D\&A & 350.820 & 343.662 & 351.966 & 343.437 & 340.163 \\ \hline Gross Income & 415.964 & 419.723 & 442.236 & 411.163 & 406.496 \\ SG\&A Expense & 367.097 & 361.773 & 353.057 & 345.229 & 336.860 \\ \hline EBIT (Operating Income) & 48.867 & 57.950 & 89.179 & 65.934 & 69.636 \\ Interest Expense & 0.325 & 1.223 & 1.618 & 5.957 & 7.540 \\ Other Income-Net & 0.525 & 0.268 & 0.395 & 1.206 & 0.306 \\ Unusual Expense - Net & 0.000 & 0.000 & 0.000 & 4.500 & 0.000 \\ \hline Pretax Income & 49.067 & 56.995 & 87.956 & 56.683 & 62.402 \\ Income Taxes & 12.696 & 20.801 & 31.319 & 19.541 & 19.471 \\ \hline Net Income & 36.371 & 36.194 & 56.637 & 37.142 & 42.931 \\ \hline \end{tabular} Souree ; FactSet Fundamentals Ehan Allen Interiors lac, Balance Sbeet (Induntrial) All fequres in millions of U.S. Dollar, exeept per share items
Step by Step Solution
There are 3 Steps involved in it

Get step-by-step solutions from verified subject matter experts