

Question: 3. Using the ETF Data.xlsx workbook from the chapter: b. C. Using Get & Transform, clean up the data as described in the chapter,
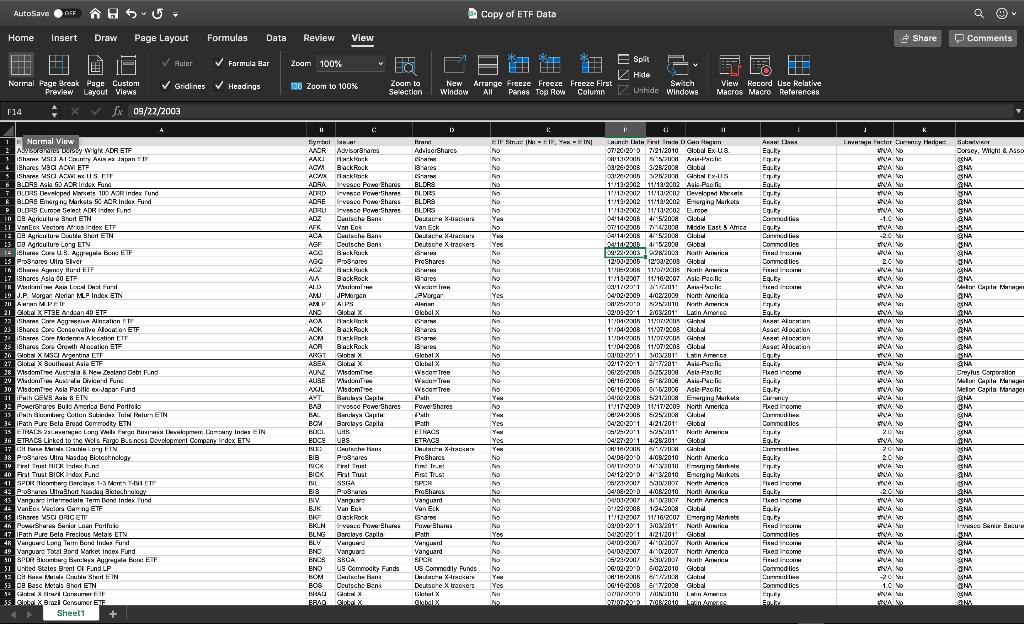
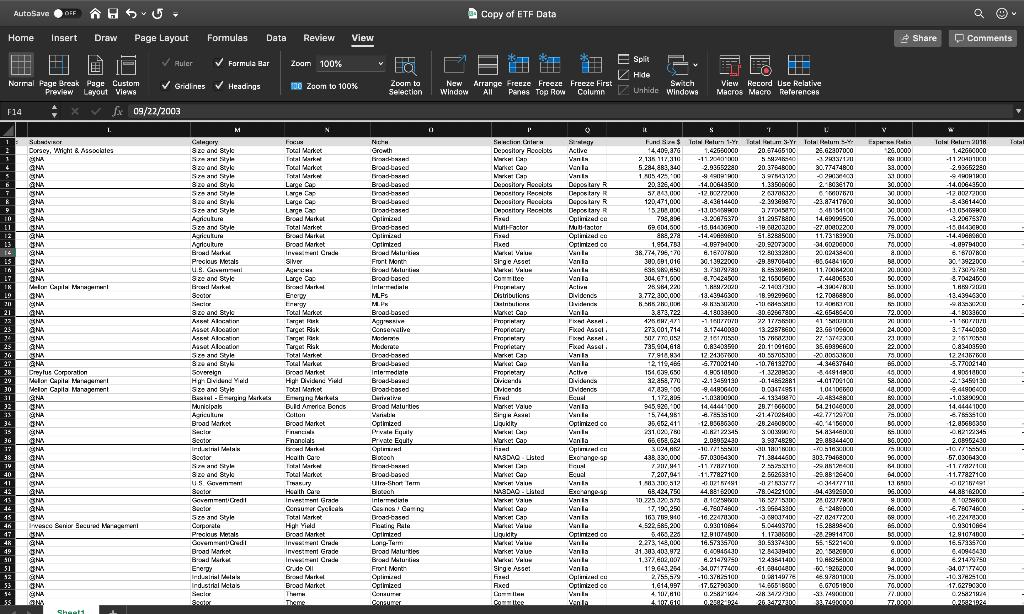
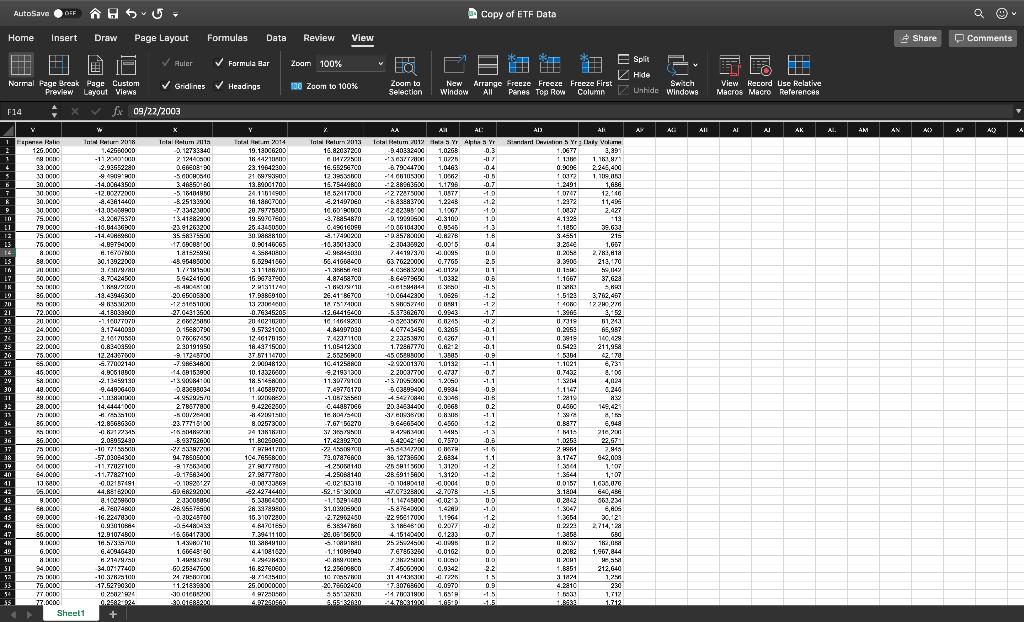
3. Using the ETF Data.xlsx workbook from the chapter: b. C. Using Get & Transform, clean up the data as described in the chapter, and keep only the Fund Name, Symbol, Asset Class, Total Return 2016, Total Return 2015, and Total Return 2014 fields. e. Create calculated columns in the original data that calculate the 2014 to 2016 total return for each ETF and for each Asset Class. Be sure to properly account for compounding of returns. Create a pivot table to show the average three-year total return for each asset class, and sort the pivot table from the highest return category to the lowest. Which asset class did the best? Worst? d. Create a pivot bar chart that shows the returns of the top 3 best performing asset classes over the last three years. Create another pivot table from this dataset, and then a calculated field that shows each ETF's three-year return minus the asset class three-year return. Which fund did best compared to its asset class over the three-year period? Which did the worst?
Step by Step Solution
3.48 Rating (165 Votes )
There are 3 Steps involved in it

Get step-by-step solutions from verified subject matter experts