

The scatter plot shows the average scores of 10 golfers and their weekly practice times. The line
Question:
The scatter plot shows the average scores of 10 golfers and their weekly practice times. The line of best fit is also shown.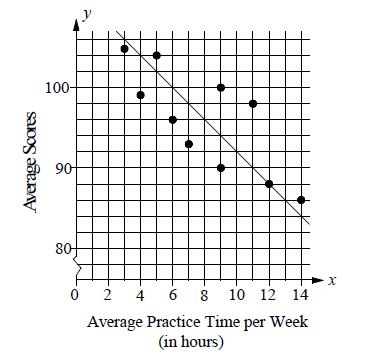
What is the average score of the golfer that is farthest from the line of best fit?
A) 93
B) 96
C) 98
D) 99
Fantastic news! We've Found the answer you've been seeking!
Step by Step Answer:
C The average score of the golfer that is farth...View the full answer

Answered By
Wahome Michael
I am a CPA finalist and a graduate in Bachelor of commerce. I am a full time writer with 4 years experience in academic writing (essays, Thesis, dissertation and research). I am also a full time writer which assures you of my quality, deep knowledge of your task requirement and timeliness. Assign me your task and you shall have the best.
Thanks in advance
63+ Reviews
132+ Question Solved
Related Book For 
Question Posted:
