

The scatter plot shows the average scores of 10 golfers and their weekly practice times. The line
Question:
The scatter plot shows the average scores of 10 golfers and their weekly practice times. The line of best fit is also shown.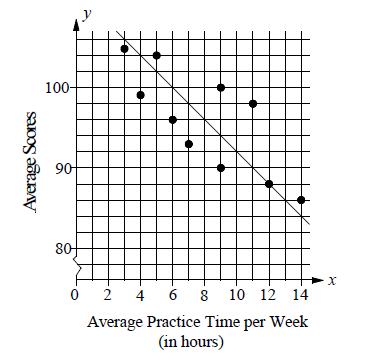
There are two golfers whose average practice time is the same. What is the difference between their average scores?
A) 4
B) 6
C) 8
D) 10
Fantastic news! We've Found the answer you've been seeking!
Step by Step Answer:
D There are two golfers who...View the full answer

Answered By
BETHUEL RUTTO
Hi! I am a Journalism and Mass Communication graduate; I have written many academic essays, including argumentative essays, research papers, and literary analysis. I have also proofread and written reviews, summaries and analyses on already finished works. I am eager to continue writing!
1+ Reviews
10+ Question Solved
Related Book For 
Question Posted:
