

The scatter plot shows the average scores of 10 golfers and their weekly practice times. The line
Question:
The scatter plot shows the average scores of 10 golfers and their weekly practice times. The line of best fit is also shown.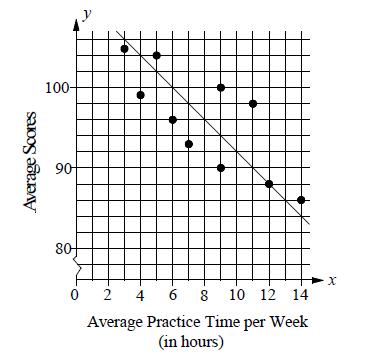 What is the median score of the 10 golfers?
A) 96
B) 97
C) 98
D) 99
Fantastic news! We've Found the answer you've been seeking!
Step by Step Answer:
B The list of the 10 golfers average scores ...View the full answer

Answered By
Navashree Ghosh
I believe in quality work and customer satisfaction. So, I can assure you that you will get quality work from me when you hire me. Let's work together and build a long-term association.
82+ Reviews
116+ Question Solved
Related Book For 
Question Posted:
