

Question: Take a sample, for instance, that in Prob. 4, and investigate and graph the effect of changing y-values (a) For small x (b) For large
Take a sample, for instance, that in Prob. 4, and investigate and graph the effect of changing y-values
(a) For small x
(b) For large x
(c) In the middle of the sample.
Data from Prob. 4
Find and graph the sample regression line of y on x and the given data as points on the same axes. Show the details of your work.
x = Deformation of a certain steel [mm], y = Brinell hardness [kg/mm2]
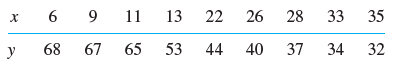
x 6 9 y 11 11 13 22 26 28 68 67 65 33 35 53 44 40 37 34 32
Step by Step Solution
3.42 Rating (165 Votes )
There are 3 Steps involved in it
To investigate the effect of changing yvalues on the sample regression line and the given data we ca... View full answer

Get step-by-step solutions from verified subject matter experts