

Question: A article in Graefes Archive for Clinical and Experimental Ophthalmology [Statistical Process Control Charts for Ophthalmology, considered the number of cataract surgery cases by month.
(a) What type of control chart is appropriate for these data? Construct this chart.
(b) Comment on the control of the process.
(c) If necessary, assume that assignable causes can be found, eliminate suspect points, and revise the control limits.
(d) In the publication, the data were approximated as normally distributed and an individuals chart was constructed. Construct this chart and compare it to the attribute chart you built in part (a). Why might an individuals chart be reasonable?
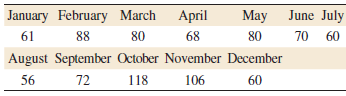
January February March April 88 61 August September June July May 80 70 68 70 60 80 October November December 72 60 56 118 106
Step by Step Solution
3.49 Rating (172 Votes )
There are 3 Steps involved in it
a A CChart is appropriate for this data b Two points points 10 a... View full answer

Get step-by-step solutions from verified subject matter experts