

Question: The data in the following table give the average high temperature in Chicago for certain months. a) Using the SINE REGRESSION feature on a graphing
The data in the following table give the average high temperature in Chicago for certain months.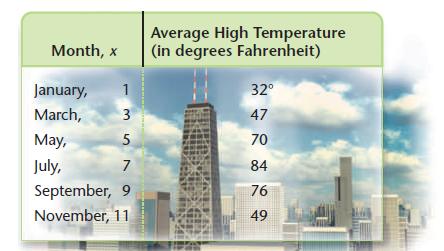
a) Using the SINE REGRESSION feature on a graphing calculator, fit a sine function of the form y = A sin (BX - C) + D to this set of data.
b) Approximate the average high temperature in Chicago in April and in December.
c) Determine in which months the average high temperature is about 63°.
Month, x January, 1 March, 3 May, 5 July, 7 September, 9 November, 11 Average High Temperature (in degrees Fahrenheit) 32 47 70 84 76 49
Step by Step Solution
3.32 Rating (161 Votes )
There are 3 Steps involved in it
a y 263148 sin 0... View full answer

Get step-by-step solutions from verified subject matter experts