

Question: Figure 6-40 shows a partially completed chart for a program that displays the amount of a salespersons commission. The commission is based on the salespersons
Figure 6-40 shows a partially completed chart for a program that displays the amount of a salesperson’s commission. The commission is based on the salesperson’s sales amount, as indicated in the figure. Complete the selection structure in the Algorithm section of the chart. Also complete the C++ instructions section. After completing the chart, create a new project (if necessary) named TryThis10 Project, and save it in the Cpp8\Chap06 folder. Enter the C++ instructions into a source file named TryThis10.cpp. Also enter appropriate comments and any additional instructions required by the compiler.
Display the commission in fixed-point notation with two decimal places. Save and run the program. Test the program using the following sales amounts: 15250, 251990, 500670, and –5.
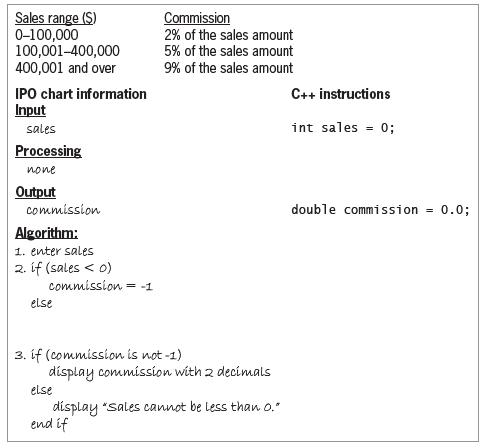
Sales range (S) 0-100,000 100,001-400,000 400,001 and over Commission 2% of the sales amount 5% of the sales amount 9% of the sales amount IPO chart information Input C++ instructions sales int sales = 0; Processing none Output commission double commission = 0.0; Algorithm: 1. enter sales 2. if (sales < o) commission = -1 else 3. if (commission is not -1) display commission with 2 decimals else display "sales cannot be less than o." end if
Step by Step Solution
3.55 Rating (169 Votes )
There are 3 Steps involved in it
TryThis10cpp displays a salespersons commission Cr... View full answer

Get step-by-step solutions from verified subject matter experts