

It is possible to generate performance curves for the reactor in Section 22. 1. One type of
Question:
It is possible to generate performance curves for the reactor in Section 22. 1. One type of performance curve would have the rate of cumene production \((\mathrm{kmol} / \mathrm{h})\) on the \(y\)-axis, and the percent propane impurity in the propylene on the \(x\)-axis. There would be lines for different operating temperatures all at constant pressure.
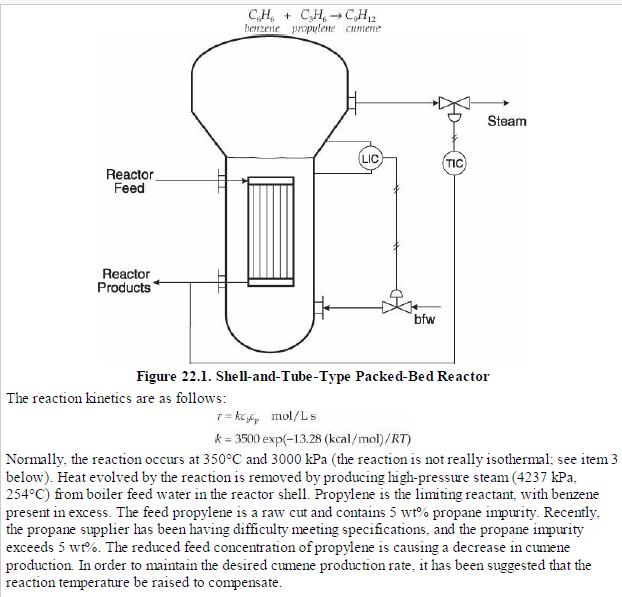
Assume that the feed to the reactor is \(108 \mathrm{kmol} / \mathrm{h}\) propylene, \(8 \mathrm{kmol} / \mathrm{h}\) propane, and \(203 \mathrm{kmol} / \mathrm{h}\) benzene. The pressure is kept constant at \(3000 \mathrm{kPa}\). Prepare performance curves on the same graph for temperatures from \(350^{\circ} \mathrm{C}\) to \(400^{\circ} \mathrm{C}\) in \(10^{\circ} \mathrm{C}\) intervals. Superimpose on this graph the maximum allowable conditions, which correspond to a steam-side pressure of \(4800 \mathrm{kPa}\). A process simulator should be used to generate points on the performance curves. Other data: reactor volume \(=7.89 \mathrm{~m}^{3}\), heat transfer area \(A=436 \mathrm{~m}^{2}\), overall heat transfer coefficient \(=65\) \(\mathrm{W} / \mathrm{m}^{2{ }^{\circ} \mathrm{C}}\).
Data from section 22.1

Step by Step Answer:

This question has not been answered yet.
You can Ask your question!

Analysis Synthesis And Design Of Chemical Processes
ISBN: 9780132618120
4th Edition
Authors: Richard Turton, Richard C. Bailie, Wallace B. Whiting, Joseph A. Shaeiwitz, Debangsu Bhattacharyya
