

The temperature interval diagram for a process is shown in Figure P15.16. For this process do the
Question:
The temperature interval diagram for a process is shown in Figure P15.16. For this process do the following: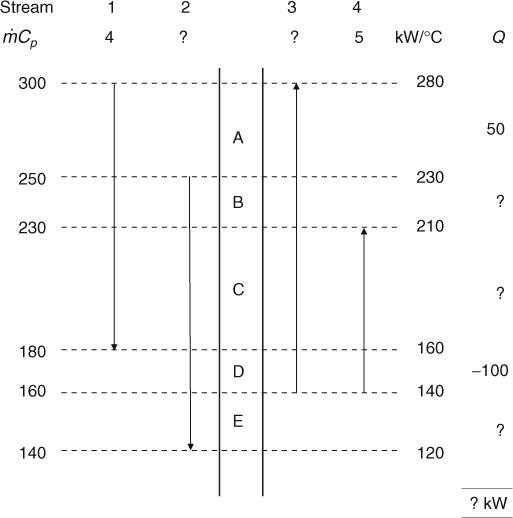
- Compute the missing values of ṁCp for Streams 2 and 3, the missing Q values for temperature intervals B, C, and E, and the total of all intervals.
- Calculate the minimum hot and cold utility loads for this process subject to a minimum approach temperature of 20°C.
- Calculate the pinch temperatures for this process. You may assume that there is only one hot and one cold utility available.
- Calculate the minimum number of exchangers needed for the minimum energy case for above and below the pinch.
- Design the MUMNE network for the process.
Fantastic news! We've Found the answer you've been seeking!
Step by Step Answer:

Answered By
GERALD KAMAU
non-plagiarism work, timely work and A++ work
6+ Reviews
11+ Question Solved
Related Book For 
Analysis Synthesis And Design Of Chemical Processes
ISBN: 9780134177403
5th Edition
Authors: Richard Turton, Joseph Shaeiwitz, Debangsu Bhattacharyya, Wallace Whiting
Question Posted:
