

Question: This exercise was also contributed by Dr. Rick Wilson of Oklahoma State University to illustrate the modeling capabilities of Excel Solver. National signing day for
This exercise was also contributed by Dr. Rick Wilson of Oklahoma State University to illustrate the modeling capabilities of Excel Solver.
National signing day for rugby recruiting season 2018 has been completed. Now, as the recruiting coordinator for the San Diego State University Aztec rugby team, it is time to analyze the results and plan for 2019.
You've developed complex analytics and data collection processes and applied them for the past few recruiting seasons to help you develop a plan for 2019. Basically, you have divided the area in which you actively recruit rugby players into eight different regions. Each region has a pertarget cost, a "star rating" (average recruit "star" ranking, from 0 to 5, similar to what Rivals uses for football), a yield or acceptance rate percentage (the percentage of targeted recruits who come to SDSU), and a visibility measure, which represents a measure of how much publicity SDSU gets for recruiting in that region, measured per target (increased visibility will enhance future recruiting efforts).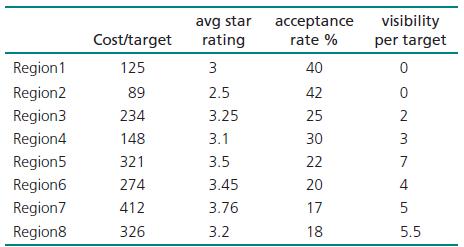
Your goal is to create a LINEAR mathematical model that determines the number of target recruits you should pursue in each region in order to have an estimated yield (expected number) of at least 25 rugby recruits for next year while minimizing cost. (Region 1 with yield of 40%:
if we target 10 people, the expected number that will come is .4 * 1 0 = 4 0 .) In determining the optimal number of targets in each region (which, not surprisingly, should be integer values), you must also satisfy the following conditions:
• No more than 20% of the total targets (not the expected number of recruits) should be from any one region.
• Each region should have at least 4% of the total targets (again, not the expected number of recruits, but the number of targets).
• The average star rating of the targets must be at least equal to 3.3.
• The average visibility value of the targets must be at least equal to 3.5.
• Off on the recruiting trail you go!
Region 1 Region2 Region3 Region4 Region5 Region6 Region7 Region8 Cost/target 125 89 234 148 321 274 412 326 avg star rating 3 2.5 3.25 3.1 3.5 3.45 3.76 3.2 acceptance rate % 40 42 25 30 22 20 17 18 visibility per target 0 0 ~374 2 5 5.5
Step by Step Solution
3.28 Rating (154 Votes )
There are 3 Steps involved in it
To create a linear mathematical model for determining the optimal number of recruits in each region ... View full answer

Get step-by-step solutions from verified subject matter experts